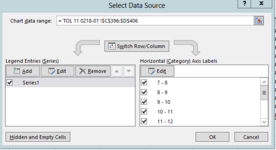
Excel chart - edit Axis Label Range

garyj68

New Member
Joined
Mar 8, 2021
Messages
9
Office Version
  1. 2016
Platform
  1. Windows
Hi,

I have a chart and using the Select Data Source option, I have linked the values in the 'Horizontal(Category) Axis Labels' section to cells on a worksheet. This works great.

My question is how to change these labels using VBA.

Thanks

1633612891498.png
 

Attachments

  • 1633612658493.png
    1633612658493.png
    20.8 KB · Views: 6

Excel Facts

Why are there 1,048,576 rows in Excel?
The Excel team increased the size of the grid in 2007. There are 2^20 rows and 2^14 columns for a total of 17 billion cells.
Have you tried recording a macro of yourself doing it manually, then modifying the resulting code to suit your exact requirements?
 
Upvote 0

Forum statistics

Threads
1,214,920
Messages
6,122,279
Members
449,075
Latest member
staticfluids

We've detected that you are using an adblocker.

We have a great community of people providing Excel help here, but the hosting costs are enormous. You can help keep this site running by allowing ads on MrExcel.com.
Allow Ads at MrExcel

Which adblocker are you using?

Disable AdBlock

Follow these easy steps to disable AdBlock

1)Click on the icon in the browser’s toolbar.
2)Click on the icon in the browser’s toolbar.
2)Click on the "Pause on this site" option.
Go back

Disable AdBlock Plus

Follow these easy steps to disable AdBlock Plus

1)Click on the icon in the browser’s toolbar.
2)Click on the toggle to disable it for "mrexcel.com".
Go back

Disable uBlock Origin

Follow these easy steps to disable uBlock Origin

1)Click on the icon in the browser’s toolbar.
2)Click on the "Power" button.
3)Click on the "Refresh" button.
Go back

Disable uBlock

Follow these easy steps to disable uBlock

1)Click on the icon in the browser’s toolbar.
2)Click on the "Power" button.
3)Click on the "Refresh" button.
Go back
Back
Top