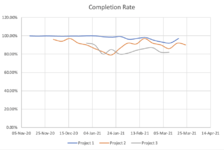
Hi All, I've tried to create a line/scatter chart to track multiple projects with different timelines but I am stuck.
The idea is that each project is run once a week and receives a 'completion score' out of 100%.
The projects have different start dates, but I would like to chart them on the same graph, representing those different start dates
The projects are run on different days of the week (so they lose the date commonality)
Project 1 started before subsequent projects, but as each new project is started, they will all run concurrently (albeit on different weekdays)
There can be up to 15 projects running simultaneously, which is where I think Excel spits the dummy!
I had thought about making the dates all common for the week, eg, taking the Sunday as the day that they all run on, but I am otherwise kinda stuck, and not sure if I have to separate the projects into different columns.
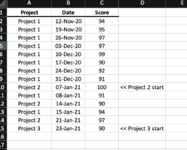
I've attached some demo data, in the format in which it is logged, and an image of what I need it to look like (which I did manually as a visual aid)
Thanks!
Steve
The idea is that each project is run once a week and receives a 'completion score' out of 100%.
The projects have different start dates, but I would like to chart them on the same graph, representing those different start dates
The projects are run on different days of the week (so they lose the date commonality)
Project 1 started before subsequent projects, but as each new project is started, they will all run concurrently (albeit on different weekdays)
There can be up to 15 projects running simultaneously, which is where I think Excel spits the dummy!
I had thought about making the dates all common for the week, eg, taking the Sunday as the day that they all run on, but I am otherwise kinda stuck, and not sure if I have to separate the projects into different columns.
I've attached some demo data, in the format in which it is logged, and an image of what I need it to look like (which I did manually as a visual aid)
Thanks!
Steve