Hi I am looking for a bit of help on a graphical representation of some processes over a 15 hour period for a 2 day sample period ( I will extend this out further , when resolved)
The end user when looking at this data should easily be able to see:
- how long each process took for each of the days, as well as
-how much latency there is between the processes
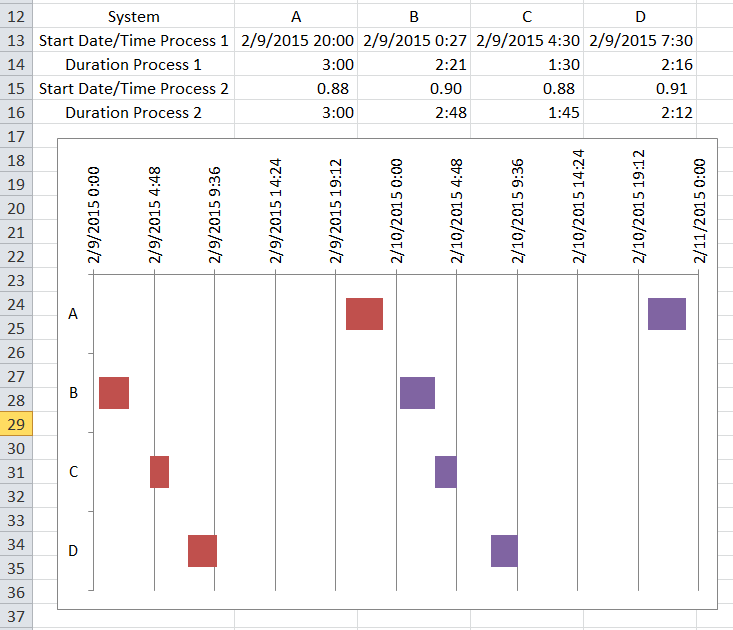
On the x axis I am looking for the time, starting at 8pm and ending at say 11am the next day, the x axis can simply just have a scale of 15 hours
On the y axis I want the calendar day. 9th and 10th of February
The visual graph of the data then needs to show the duration of these processes including any latency between at the correct point on the x axis ( i.e. start and end time) 24 hour format in data below
The data is linked to the day that it started on i.e. process A
Please refer to the table below over which has 2 days worth of data for 4 processes run each day
I did have a play around with pivot charts etc. but struggled to get a representation that I liked
Many thanks to any Excel gurus out there who can help
Date System Start time End time Duration
9-Feb A 20:00 23:00 3:00
9-Feb B 0:27 2:48 2:21
9-Feb C 4:30 6:00 1:30
9-Feb D 7:30 9:46 2:16
10-Feb A 20:00 23:00 3:00
10-Feb B 0:19 3:07 2:48
10-Feb C 3:05 4:50 1:45
10-Feb D 7:30 9:42 2:12
The end user when looking at this data should easily be able to see:
- how long each process took for each of the days, as well as
-how much latency there is between the processes
On the x axis I am looking for the time, starting at 8pm and ending at say 11am the next day, the x axis can simply just have a scale of 15 hours
On the y axis I want the calendar day. 9th and 10th of February
The visual graph of the data then needs to show the duration of these processes including any latency between at the correct point on the x axis ( i.e. start and end time) 24 hour format in data below
The data is linked to the day that it started on i.e. process A
Please refer to the table below over which has 2 days worth of data for 4 processes run each day
I did have a play around with pivot charts etc. but struggled to get a representation that I liked
Many thanks to any Excel gurus out there who can help
Date System Start time End time Duration
9-Feb A 20:00 23:00 3:00
9-Feb B 0:27 2:48 2:21
9-Feb C 4:30 6:00 1:30
9-Feb D 7:30 9:46 2:16
10-Feb A 20:00 23:00 3:00
10-Feb B 0:19 3:07 2:48
10-Feb C 3:05 4:50 1:45
10-Feb D 7:30 9:42 2:12