Excel Graph Help Please - Plotting the Fall on a Line Graph Showing Height and Length

mattwolves

New Member
Joined
Mar 9, 2018
Messages
7
Hi Folks,
I'm hope you can help.
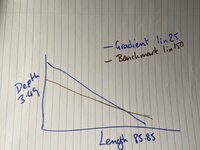
I am looking to create a graph within Excel, to show pipe fall over height and length (the gradient).
My data is as following:
Length: 85
Height: 3.50
Gradient: 25 (1 in 25)

Ideally, I want the left axis to be the height with the bottom of the graph representing length (a left and bottom line axis?).
So the line shows the gradient (25) over the length of 85. If that makes sense.
I'm sure this is pretty basic Excel stuff, but I'm completely blank at the moment.
Any help and guidance would be most appreciated.
 

Excel Facts

Select a hidden cell
Somehide hide payroll data in column G? Press F5. Type G1. Enter. Look in formula bar while you arrow down through G.
Is this what you are after? Do you need more details in your graph?

1607073552510.png
 
Upvote 0
Kinda of what I'm looking for.
Don't know whether its achievable but would want the line to start at the left access, rather than starting middle of the graph.
Would it be possible to display increments along the bottom, until it reaches 85? So it gives an appreciation of distance. If that makes sense.
Would it be possible to add a right axis, for another gradient aaa 150 (1 in 150)? This would be baseline the minimum gradient should be.

To give an insight to what I'm trying to achieve.
The graph relates to pipework. A standard pipe should be 1 in 150 gradient to achieve self cleansing velocity (this would be the right axis).
I want to demonstrate the fall of the actual gradient (left axis) over the length. So left axis is the height (starting point) and it shows the fall along that line for 85m (bottom line). The maximum the length will ever be is 100m.

Hope this makes sense and thank you in advance for taking the time out to help.
Everything is very much appreciated.
 
Upvote 0
I'm not sure what you want the secondary axis to show - do you want to display another graph (pipe) with a lower gradient? The axis in the graph shown above shows the height of the pipe at a given point from 0 to 85, not the gradient. If you were to show the gradient at any point during the length of the pipe, you'd get a flat line as it presumably is constant?

As for your question regarding how to display more values along the x-axis, I think the simplest way would be to just add more values to the table:

1607076308476.png


Note that I am subtracting 5/25 instead of 1/25 since the increment in my table is 5. I also end up slightly higher than y = 0 at x = 85 since the slope you'd need for that is like 7/170. I assume you can finetune these things on your own though.

By changing axis position from "Between tick marks" to "On tick marks" I got the graph to start at the y-axis - the gap wouldn't have been as noticable as in my first example though, since there are a lot more tick marks along the x-axis.

1607076640663.png
 
Upvote 0
Hi, apologies for the late reply, been a tad busy.
The graph is to demonstrate a gradient of 1 in25, with a height of 3.49m and length of 85.85m (I'd rounded up the figures in my initial post, but that level of detail can easily be addressed). Ideally, with an additional line showing the 'benchmark' gradient, which is 1 in 150 at the same height and length. To help my explanation, I've drawn a crude sketch on what I'd like it to show. Thanking you in advance
 

Attachments

  • Example.jpeg
    Example.jpeg
    90.6 KB · Views: 5
Upvote 0

Forum statistics

Threads
1,214,833
Messages
6,121,858
Members
449,051
Latest member
excelquestion515

We've detected that you are using an adblocker.

We have a great community of people providing Excel help here, but the hosting costs are enormous. You can help keep this site running by allowing ads on MrExcel.com.
Allow Ads at MrExcel

Which adblocker are you using?

Disable AdBlock

Follow these easy steps to disable AdBlock

1)Click on the icon in the browser’s toolbar.
2)Click on the icon in the browser’s toolbar.
2)Click on the "Pause on this site" option.
Go back

Disable AdBlock Plus

Follow these easy steps to disable AdBlock Plus

1)Click on the icon in the browser’s toolbar.
2)Click on the toggle to disable it for "mrexcel.com".
Go back

Disable uBlock Origin

Follow these easy steps to disable uBlock Origin

1)Click on the icon in the browser’s toolbar.
2)Click on the "Power" button.
3)Click on the "Refresh" button.
Go back

Disable uBlock

Follow these easy steps to disable uBlock

1)Click on the icon in the browser’s toolbar.
2)Click on the "Power" button.
3)Click on the "Refresh" button.
Go back
Back
Top