kellym9236
New Member
- Joined
- Feb 16, 2023
- Messages
- 30
- Office Version
- 365
- Platform
- Windows
Hello everyone,
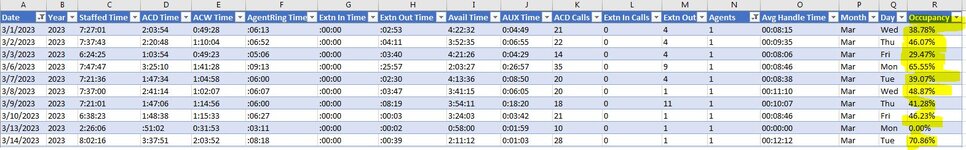
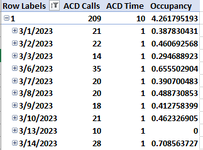
I am new to this so please bare with me and I apologize in advance for my lack of knowledge, I have attached a sheet here and what I've been trying to do is calculate occupancy rate
by using a formula I found online sum of handle time (O2) (R2) (S2) (T2) to see my formulas I don't know if they are even right cause i can't seem to create a pivotal chart or add a simple chart and show the occupancy rate percentages or the utilization rate percentages in a column or line chart, and also add the columns to get an avaerage percetgaes of all the agents, any help would be greatly appreciated My boss has tasked me to figure this out and I don't know where to start troubleshooting what I'm doing
thank you in advance for any help or direction and most importantly your time
kelly
| Test1.xlsx | ||||||||||||||||||
|---|---|---|---|---|---|---|---|---|---|---|---|---|---|---|---|---|---|---|
| E | F | G | H | I | J | K | L | M | N | O | P | Q | R | S | T | |||
| 1 | ACW Time | Agent1 | Extn In Time | Extn Out Time | Avail Time | AUX Time | ACD Calls | Extn In Calls | Extn Out Calls | Agent12 | Avg Handle Time | Month | Day | utilization | handle+Aval | Occupancy | ||
| 2 | 1:00:47 | :08:41 | :00:00 | :00:00 | 3:37:03 | 0:35:21 | 27 | 0 | 0 | Agent1 | 11:24 | Jan | Mon | 36.75% | 79.25% | 60.02% | ||
| 3 | 1:16:32 | :07:26 | :00:00 | :07:26 | 3:07:54 | 0:37:21 | 26 | 0 | 3 | Agent1 | 12:11 | Jan | Tue | 41.66% | 76.49% | 66.42% | ||
| 4 | 1:23:31 | :06:53 | :00:00 | :04:05 | 2:51:34 | 0:25:12 | 21 | 0 | 5 | Agent1 | 12:50 | Jan | Wed | 47.33% | 75.78% | 70.62% | ||
| 5 | 1:57:55 | :06:35 | :00:00 | :20:00 | 2:15:22 | 0:29:18 | 19 | 0 | 10 | Agent1 | 13:19 | Jan | Thu | 48.96% | 72.44% | 76.62% | ||
| 6 | 1:59:53 | :06:32 | :00:00 | :49:49 | 1:52:10 | 1:04:36 | 22 | 0 | 5 | Agent1 | 12:45 | Jan | Fri | 44.68% | 67.80% | 78.38% | ||
| 7 | 2:02:44 | :08:26 | :00:00 | :02:19 | 1:10:18 | 0:31:47 | 35 | 0 | 1 | Agent1 | 14:19 | Jan | Mon | 60.53% | 67.87% | 87.95% | ||
| 8 | 1:18:49 | :08:03 | :00:00 | :03:29 | 2:45:14 | 0:33:08 | 24 | 0 | 2 | Agent1 | 12:21 | Jan | Tue | 45.71% | 73.80% | 69.82% | ||
| 9 | 1:13:39 | :07:38 | :00:00 | :01:28 | 3:07:33 | 0:27:00 | 23 | 0 | 1 | Agent1 | 11:34 | Jan | Wed | 41.13% | 75.23% | 64.10% | ||
| 10 | 0:24:53 | :04:13 | :00:00 | :00:00 | 4:28:10 | 0:11:22 | 16 | 0 | 0 | Agent1 | 8:59 | Jan | Sat | 28.20% | 87.18% | 42.94% | ||
| 11 | 1:12:58 | :08:47 | :00:00 | :01:15 | 4:01:24 | 1:04:51 | 15 | 0 | 1 | Agent1 | 10:15 | Jan | Mon | 23.10% | 81.97% | 52.18% | ||
| 12 | 2:53:05 | :09:20 | :00:00 | :11:16 | 1:28:06 | 0:36:21 | 30 | 0 | 5 | Agent1 | 13:09 | Jan | Tue | 45.75% | 65.98% | 83.08% | ||
| 13 | 1:21:16 | :10:09 | :00:00 | :04:24 | 3:51:19 | 0:35:31 | 29 | 0 | 4 | Agent1 | 11:13 | Jan | Wed | 30.85% | 81.11% | 57.65% | ||
| 14 | 0:28:50 | :04:14 | :00:00 | :01:28 | 3:28:32 | 0:40:32 | 10 | 0 | 2 | Agent1 | 11:10 | Jan | Thu | 42.27% | 77.67% | 59.98% | ||
| 15 | 0:30:32 | :05:39 | :00:00 | :13:35 | 4:24:22 | 0:38:59 | 15 | 0 | 4 | Agent1 | 8:46 | Jan | Fri | 22.51% | 86.77% | 42.15% | ||
| 16 | 0:56:10 | :09:39 | :00:00 | :00:03 | 3:34:55 | 0:31:49 | 25 | 0 | 1 | Agent1 | 11:37 | Jan | Tue | 38.93% | 79.24% | 61.10% | ||
| 17 | 0:52:13 | :08:28 | :00:00 | :01:11 | 3:40:05 | 0:22:15 | 21 | 0 | 2 | Agent1 | 11:34 | Jan | Wed | 40.20% | 79.92% | 60.34% | ||
| 18 | 0:49:05 | :07:55 | :00:00 | :05:00 | 4:02:19 | 0:25:54 | 20 | 0 | 2 | Agent1 | 10:57 | Jan | Thu | 34.62% | 82.52% | 55.36% | ||
| 19 | 1:09:46 | :07:56 | :00:00 | :09:19 | 4:46:58 | 0:35:49 | 18 | 0 | 2 | Agent1 | 10:11 | Jan | Fri | 21.24% | 89.39% | 47.52% | ||
| 20 | 1:00:15 | :09:57 | :00:00 | :08:11 | 3:56:11 | 0:33:32 | 28 | 0 | 6 | Agent1 | 11:09 | Feb | Tue | 33.12% | 81.76% | 56.83% | ||
| 21 | 0:55:12 | :08:26 | :00:00 | :00:00 | 3:10:22 | 0:29:22 | 25 | 0 | 0 | Agent1 | 12:00 | Feb | Wed | 44.54% | 76.44% | 65.42% | ||
| 22 | 0:46:16 | :08:23 | :00:00 | :04:55 | 3:59:15 | 0:29:49 | 25 | 0 | 1 | Agent1 | 11:11 | Feb | Thu | 35.65% | 82.26% | 56.67% | ||
| 23 | 1:21:47 | :10:30 | :00:00 | :01:03 | 4:11:59 | 0:41:13 | 23 | 0 | 1 | Agent1 | 10:39 | Feb | Fri | 24.83% | 83.81% | 52.98% | ||
| 24 | 0:57:51 | :06:37 | :00:00 | :00:00 | 2:35:11 | 0:11:32 | 35 | 0 | 0 | Agent1 | 13:00 | Feb | Sun | 55.75% | 74.07% | 73.14% | ||
| 25 | 0:39:39 | :06:58 | :00:00 | :05:03 | 3:17:35 | 0:30:36 | 23 | 0 | 3 | Agent1 | 11:48 | Feb | Mon | 45.00% | 77.10% | 63.84% | ||
| 26 | 0:29:20 | :08:01 | :00:00 | :13:47 | 4:19:39 | 0:30:21 | 20 | 0 | 4 | Agent1 | 10:40 | Feb | Tue | 33.13% | 85.02% | 52.30% | ||
| 27 | 0:47:30 | :07:54 | :00:00 | :10:58 | 4:45:27 | 033:02 | 22 | 0 | 3 | Agent1 | 10:24 | Feb | Wed | 25.72% | 89.07% | 48.72% | ||
| 28 | 0:58:24 | :06:19 | :00:00 | :28:31 | 4:19:51 | 0:42:58 | 18 | 0 | 3 | Agent1 | 10:49 | Feb | Thu | 28.51% | 85.11% | 53.01% | ||
| 29 | 1:05:39 | :04:22 | :00:00 | :00:00 | 2:33:26 | 0:21:08 | 6 | 0 | 0 | Agent1 | 6:58 | Feb | Fri | 20.66% | 65.72% | 44.27% | ||
| 30 | 0:37:30 | :07:13 | :00:00 | :12:59 | 5:23:22 | 0:25:04 | 19 | 0 | 3 | Agent1 | 9:41 | Feb | Tue | 20.20% | 95.98% | 42.09% | ||
| 31 | 0:36:51 | :08:21 | :00:00 | :04:36 | 4:44:38 | 0:36:51 | 23 | 0 | 2 | Agent1 | 10:05 | Feb | Wed | 25.18% | 89.05% | 47.25% | ||
| 32 | 0:42:30 | :08:09 | :00:00 | :00:00 | 4:29:14 | 0:31:51 | 24 | 0 | 0 | Agent1 | 10:21 | Feb | Thu | 28.29% | 86.48% | 49.93% | ||
| 33 | 1:22:56 | :05:08 | :00:00 | :01:17 | 4:11:48 | 0:23:58 | 19 | 0 | 2 | Agent1 | 11:06 | Feb | Fri | 30.02% | 84.07% | 55.09% | ||
| 34 | 0:43:47 | :08:23 | :00:00 | :00:31 | 4:07:21 | 0:42:48 | 28 | 0 | 1 | Agent1 | 14:29 | Feb | Mon | 44.66% | 88.85% | 68.00% | ||
| 35 | 1:15:30 | :07:47 | :00:00 | :24:01 | 3:54:01 | 0:38:16 | 25 | 0 | 6 | Agent1 | 11:07 | Feb | Tue | 30.93% | 81.42% | 56.97% | ||
| 36 | 0:43:24 | :06:50 | :00:00 | :00:00 | 4:26:34 | 0:31:40 | 21 | 0 | 0 | Agent1 | 10:40 | Feb | Wed | 30.31% | 86.10% | 51.69% | ||
| 37 | 0:57:00 | :06:16 | :00:00 | :00:00 | 4:27:06 | 0:35:20 | 21 | 0 | 0 | Agent1 | 10:29 | Feb | Thu | 27.06% | 86.15% | 50.76% | ||
| 38 | 0:55:48 | :06:14 | :00:00 | :20:26 | 3:34:44 | 0:51:12 | 15 | 0 | 1 | Agent1 | 10:11 | Feb | Fri | 30.82% | 77.58% | 54.72% | ||
| 39 | 0:24:01 | :03:58 | :00:00 | :00:00 | 4:50:22 | 0:10:01 | 17 | 0 | 0 | Agent1 | 8:39 | Feb | Sat | 23.57% | 91.97% | 39.22% | ||
| 40 | 0:50:02 | :08:39 | :00:00 | :03:50 | 3:42:01 | 0:31:54 | 31 | 0 | 3 | Agent1 | 11:38 | Mar | Tue | 38.87% | 80.29% | 60.41% | ||
| 41 | 0:38:47 | :06:10 | :00:00 | :00:47 | 4:24:40 | 0:32:39 | 25 | 0 | 3 | Agent1 | 11:16 | Mar | Wed | 33.57% | 86.10% | 54.54% | ||
| 42 | 0:32:08 | :05:40 | :00:00 | :00:03 | 4:58:51 | 0:31:19 | 22 | 0 | 1 | Agent1 | 10:05 | Mar | Thu | 25.18% | 91.40% | 46.02% | ||
| 43 | 1:21:35 | :06:25 | :00:00 | :00:00 | 4:19:10 | 0:30:27 | 19 | 0 | 0 | Agent1 | 10:46 | Mar | Fri | 26.69% | 84.98% | 52.84% | ||
| 44 | 0:12:12 | :01:48 | :00:00 | :01:58 | 5:04:24 | 0:12:51 | 8 | 0 | 2 | Agent1 | 7:02 | Mar | Sat | 15.81% | 101.43% | 28.90% | ||
| 45 | 0:09:50 | :01:27 | :00:00 | :09:54 | 5:37:34 | 0:51:20 | 6 | 0 | 2 | Agent1 | 6:33 | Mar | Sun | 5.45% | 113.04% | 24.20% | ||
| 46 | 1:31:25 | :07:37 | :00:00 | :19:25 | 1:47:53 | 0:23:22 | 36 | 0 | 3 | Agent1 | 13:35 | Mar | Mon | 58.22% | 69.88% | 81.08% | ||
| 47 | 0:48:06 | :07:37 | :00:00 | :12:23 | 4:06:38 | 0:29:55 | 26 | 0 | 12 | Agent1 | 11:02 | Mar | Tue | 33.65% | 83.23% | 55.24% | ||
| 48 | 1:27:58 | :06:32 | :00:00 | :38:33 | 3:46:14 | 0:32:41 | 21 | 0 | 6 | Agent1 | 11:23 | Mar | Wed | 32.45% | 80.57% | 58.95% | ||
| 49 | 0:37:36 | :04:52 | :00:00 | :41:24 | 4:48:07 | 1:10:01 | 17 | 0 | 5 | Agent1 | 9:35 | Mar | Thu | 18.69% | 90.03% | 44.38% | ||
| 50 | 1:10:53 | :05:35 | :00:00 | :14:12 | 4:35:52 | 0:42:34 | 16 | 0 | 4 | Agent1 | 10:18 | Mar | Fri | 22.61% | 87.55% | 49.10% | ||
| 51 | 0:26:39 | :03:59 | :00:00 | :02:17 | 4:18:27 | 0:15:18 | 18 | 0 | 0 | Agent1 | 9:13 | Mar | Sat | 29.83% | 85.13% | 45.15% | ||
| 52 | 0:53:05 | :08:28 | :00:00 | :02:23 | 4:13:51 | 0:30:58 | 27 | 0 | 4 | Agent1 | 10:53 | Mar | Mon | 31.11% | 84.22% | 53.85% | ||
| 53 | 0:33:58 | :04:59 | :00:00 | :05:37 | 4:47:30 | 0:30:43 | 16 | 0 | 4 | Agent1 | 10:14 | Mar | Thu | 27.58% | 89.46% | 47.72% | ||
| 54 | 0:24:39 | :04:30 | :00:00 | :01:11 | 5:40:50 | 0:25:05 | 15 | 0 | 1 | Agent1 | 9:18 | Mar | Fri | 18.71% | 99.80% | 38.89% | ||
| 55 | 0:33:43 | :04:54 | :00:00 | :04:12 | 4:35:38 | 0:05:54 | 26 | 0 | 2 | Agent1 | 11:02 | Mar | Sat | 35.58% | 87.61% | 52.50% | ||
| 56 | 0:56:49 | :06:05 | :00:00 | :03:06 | 3:43:34 | 0:26:51 | 21 | 0 | 1 | Agent1 | 11:25 | Mar | Mon | 38.19% | 80.22% | 59.37% | ||
| 57 | 0:54:55 | :05:50 | :00:00 | :12:20 | 4:44:20 | 0:45:57 | 17 | 0 | 3 | Agent1 | 10:06 | Mar | Tue | 22.23% | 89.00% | 47.29% | ||
| 58 | 1:23:22 | :05:34 | :00:00 | :19:03 | 4:31:40 | 0:34:10 | 20 | 0 | 2 | Agent1 | 10:37 | Mar | Wed | 23.76% | 86.89% | 50.97% | ||
| 59 | 0:48:31 | :05:32 | :00:00 | :21:33 | 3:45:12 | 0:49:04 | 17 | 0 | 4 | Agent1 | 11:01 | Mar | Thu | 34.55% | 79.98% | 57.44% | ||
| 60 | 1:06:09 | :06:05 | :00:00 | :12:33 | 4:25:10 | 0:41:53 | 19 | 0 | 3 | Agent1 | 10:05 | Mar | Fri | 23.17% | 85.84% | 48.95% | ||
| 61 | 0:52:08 | :07:44 | :00:00 | :00:07 | 3:19:42 | 0:30:38 | 32 | 0 | 3 | Agent1 | 12:00 | Mar | Mon | 43.48% | 77.76% | 64.37% | ||
| 62 | 0:37:21 | :06:08 | :00:00 | :06:56 | 4:45:04 | 0:27:33 | 21 | 0 | 3 | Agent1 | 10:29 | Mar | Wed | 28.47% | 89.00% | 49.08% | ||
| 63 | 0:36:09 | :05:50 | :00:00 | :32:56 | 3:56:20 | 0:50:04 | 23 | 0 | 6 | Agent1 | 10:59 | Mar | Thu | 34.13% | 81.63% | 56.09% | ||
| 64 | 1:26:23 | :04:30 | :00:00 | :09:50 | 4:27:47 | 0:27:55 | 20 | 0 | 7 | Agent1 | 10:43 | Apr | Fri | 25.13% | 86.30% | 51.79% | ||
| 65 | 1:06:17 | :03:33 | :00:00 | :23:33 | 3:48:26 | 0:05:48 | 19 | 0 | 3 | Agent1 | 10:30 | Apr | Sun | 35.52% | 80.02% | 54.75% | ||
| 66 | 0:54:45 | :07:13 | :00:00 | :53:12 | 2:45:17 | 1:18:06 | 34 | 0 | 9 | Agent1 | 12:21 | Apr | Mon | 42.42% | 73.80% | 69.81% | ||
| 67 | 0:56:30 | :05:41 | :00:00 | :21:53 | 3:44:32 | 0:46:33 | 25 | 0 | 5 | Agent1 | 11:37 | Apr | Tue | 36.09% | 80.64% | 60.10% | ||
| 68 | 1:25:10 | :06:32 | :00:00 | :05:18 | 3:36:53 | 0:24:46 | 23 | 0 | 6 | Agent1 | 11:46 | Apr | Wed | 36.74% | 79.76% | 61.52% | ||
| 69 | 0:45:30 | :05:29 | :00:00 | :04:36 | 3:34:15 | 0:24:45 | 18 | 0 | 6 | Agent1 | 11:00 | Apr | Thu | 39.84% | 78.31% | 58.60% | ||
| 70 | 0:37:18 | :04:37 | :00:00 | :12:06 | 4:34:16 | 0:38:00 | 22 | 0 | 6 | Agent1 | 10:26 | Apr | Tue | 28.43% | 87.28% | 49.86% | ||
| 71 | 0:53:13 | :06:01 | :00:00 | :09:58 | 4:39:02 | 0:30:38 | 26 | 0 | 5 | Agent1 | 10:24 | Apr | Wed | 26.11% | 88.05% | 49.28% | ||
| 72 | 0:50:51 | :03:48 | :00:00 | :14:20 | 4:29:00 | 0:27:18 | 17 | 0 | 2 | Agent1 | 10:46 | Apr | Thu | 30.57% | 86.50% | 51.89% | ||
| 73 | 0:55:52 | :03:39 | :00:00 | :21:24 | 4:40:23 | 0:38:42 | 17 | 0 | 5 | Agent1 | 10:20 | Apr | Fri | 24.89% | 88.28% | 48.77% | ||
| 74 | 0:33:18 | :04:02 | :00:00 | :03:40 | 5:49:19 | 0:04:24 | 18 | 0 | 2 | Agent1 | 9:43 | Apr | Sun | 20.87% | 100.39% | 40.37% | ||
| 75 | 1:09:12 | :06:12 | :00:00 | :09:43 | 3:09:51 | 0:30:23 | 29 | 0 | 3 | Agent1 | 12:25 | Apr | Mon | 44.33% | 77.23% | 67.02% | ||
| 76 | 0:46:29 | :04:42 | :00:00 | :20:28 | 4:28:14 | 0:39:21 | 21 | 0 | 3 | Agent1 | 10:21 | Apr | Tue | 27.41% | 86.32% | 50.01% | ||
| 77 | 1:18:50 | :05:17 | :00:00 | :28:15 | 3:04:10 | 0:43:48 | 25 | 0 | 11 | Agent1 | 12:02 | Apr | Wed | 40.57% | 75.68% | 66.34% | ||
| 78 | 0:46:35 | :04:54 | :00:00 | :06:46 | 4:06:26 | 0:31:30 | 24 | 0 | 2 | Agent1 | 11:09 | Apr | Thu | 34.77% | 83.30% | 55.81% | ||
| 79 | 0:50:44 | :04:45 | :00:00 | :07:27 | 4:38:37 | 0:44:25 | 18 | 0 | 3 | Agent1 | 10:18 | Apr | Fri | 24.73% | 88.00% | 48.77% | ||
| 80 | 0:33:18 | :03:58 | :00:00 | :01:49 | 6:05:10 | 0:09:24 | 21 | 0 | 1 | Agent1 | 9:23 | Apr | Sun | 16.45% | 103.94% | 37.64% | ||
| 81 | 1:00:15 | :06:13 | :00:00 | :11:18 | 3:08:30 | 0:40:06 | 31 | 0 | 6 | Agent1 | 11:59 | Apr | Mon | 42.66% | 76.15% | 65.58% | ||
| 82 | 0:52:17 | :04:56 | :00:00 | :15:21 | 3:49:36 | 0:43:18 | 25 | 0 | 12 | Agent1 | 11:10 | Apr | Tue | 34.40% | 80.80% | 57.59% | ||
| 83 | 0:52:06 | :05:51 | :00:00 | :31:34 | 3:49:55 | 0:51:29 | 29 | 0 | 8 | Agent1 | 10:50 | Apr | Wed | 31.78% | 80.52% | 56.13% | ||
| 84 | 0:50:03 | :05:54 | :00:00 | :01:33 | 3:34:44 | 0:26:37 | 27 | 0 | 1 | Agent1 | 11:46 | Apr | Thu | 41.63% | 79.45% | 61.74% | ||
| 85 | 0:42:16 | :03:59 | :00:00 | :14:43 | 3:50:53 | 0:16:23 | 20 | 0 | 4 | Agent1 | 11:39 | Apr | Fri | 41.92% | 81.59% | 59.55% | ||
Agent Data | ||||||||||||||||||
| Cell Formulas | ||
|---|---|---|
| Range | Formula | |
| O2:O85 | O2 | =C2+D2+E2-I2/K2 |
| P2:P85 | P2 | =TEXT(A2, "MMM") |
| Q2:Q85 | Q2 | =TEXT(A2, "DDD") |
| R2:R85 | R2 | =E2+D2/C2 |
| S2:S85 | S2 | =O2+I2/O2 |
| T2:T85 | T2 | =O2/S2 |