Excel Pivot Chart - Tick marks & Gridlines not aligned

moose79

New Member
Joined
Apr 17, 2022
Messages
6
Office Version
  1. 365
Platform
  1. MacOS
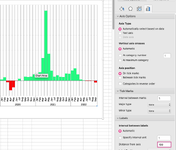
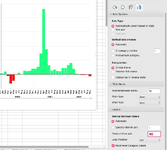
I cant get the Tick marks on my chart to line up with my gridlines when i set the interval to be 12. Im setting it to 12 because I only want gridlines visible for the end/beginning of each year. When i leave the tick mark intervals to its default 1, the lines appear to be in the correct locations, theres just too many of them for me. How do I fix this?
Screenshot at Oct 26 14-45-31.pngScreenshot at Oct 26 14-45-07.png
 

Excel Facts

Who is Mr Spreadsheet?
Author John Walkenbach was Mr Spreadsheet until his retirement in June 2019.

Forum statistics

Threads
1,214,918
Messages
6,122,257
Members
449,075
Latest member
staticfluids

We've detected that you are using an adblocker.

We have a great community of people providing Excel help here, but the hosting costs are enormous. You can help keep this site running by allowing ads on MrExcel.com.
Allow Ads at MrExcel

Which adblocker are you using?

Disable AdBlock

Follow these easy steps to disable AdBlock

1)Click on the icon in the browser’s toolbar.
2)Click on the icon in the browser’s toolbar.
2)Click on the "Pause on this site" option.
Go back

Disable AdBlock Plus

Follow these easy steps to disable AdBlock Plus

1)Click on the icon in the browser’s toolbar.
2)Click on the toggle to disable it for "mrexcel.com".
Go back

Disable uBlock Origin

Follow these easy steps to disable uBlock Origin

1)Click on the icon in the browser’s toolbar.
2)Click on the "Power" button.
3)Click on the "Refresh" button.
Go back

Disable uBlock

Follow these easy steps to disable uBlock

1)Click on the icon in the browser’s toolbar.
2)Click on the "Power" button.
3)Click on the "Refresh" button.
Go back
Back
Top