bencar
Banned user
- Joined
- Jun 8, 2016
- Messages
- 149
Hi guys,
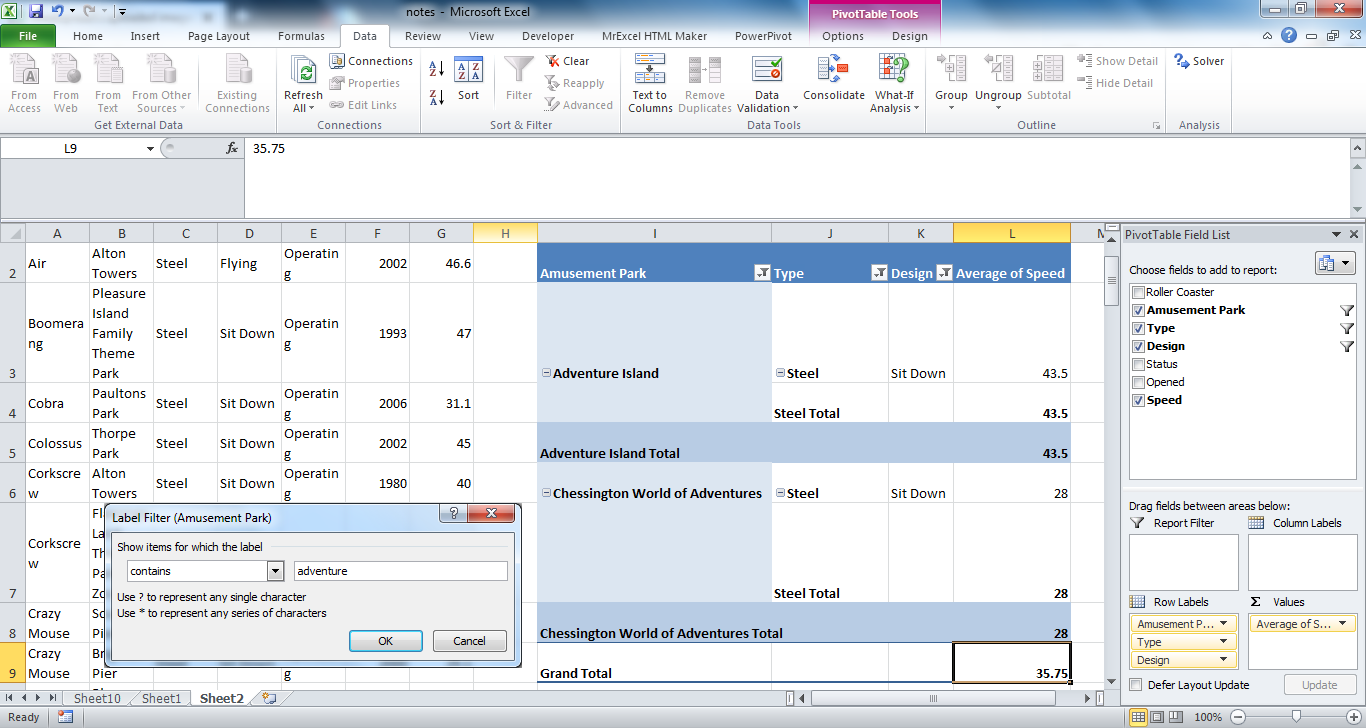
Trying to figure out why this pivot table is layed out the way it is. Here are my 4 questions. Below that is the exercise and its info.
1. Why is 'design' in the column area?
2. Why are 'amusement park' and 'roller coaster' in the row area?
3. Why is 'type' in the filter section?
4. In creating pivot tables in the future where should I put data into which PT data fields??
Heres the exercise. And below is all the info:
Convert this data into a pivot table and find the overall average speed of all rides that satisfy the following criteria:
<colgroup><col><col><col><col><col><col><col></colgroup><tbody>
</tbody>
Trying to figure out why this pivot table is layed out the way it is. Here are my 4 questions. Below that is the exercise and its info.
1. Why is 'design' in the column area?
2. Why are 'amusement park' and 'roller coaster' in the row area?
3. Why is 'type' in the filter section?
4. In creating pivot tables in the future where should I put data into which PT data fields??
Heres the exercise. And below is all the info:
Convert this data into a pivot table and find the overall average speed of all rides that satisfy the following criteria:
- The Type is Steel.
- The Design is Sit Down.
- The Amusement Park has the word adventure somewhere in the title.
| Roller Coaster | Amusement Park | Type | Design | Status | Opened | Speed |
| Air | Alton Towers | Steel | Flying | Operating | 2002 | 46.6 |
| Boomerang | Pleasure Island Family Theme Park | Steel | Sit Down | Operating | 1993 | 47 |
| Cobra | Paultons Park | Steel | Sit Down | Operating | 2006 | 31.1 |
| Colossus | Thorpe Park | Steel | Sit Down | Operating | 2002 | 45 |
| Corkscrew | Alton Towers | Steel | Sit Down | Operating | 1980 | 40 |
| Corkscrew | Flamingo Land Theme Park & Zoo | Steel | Sit Down | Operating | 1983 | 40 |
| Crazy Mouse | South Pier | Steel | Sit Down | Operating | 1998 | 29.1 |
| Crazy Mouse | Brighton Pier | Steel | Sit Down | Operating | 2000 | 29.1 |
| Enigma | Pleasurewood Hills | Steel | Sit Down | Operating | 1995 | 34 |
| Express | M&Ds Scotland's Theme Park | Steel | Sit Down | Operating | 2006 | 28 |
| Fantasy Mouse | Fantasy Island | Steel | Sit Down | Operating | 2000 | 29.1 |
| G Force | Drayton Manor Park | Steel | Sit Down | Operating | 2005 | 43.5 |
| Grand National | Pleasure Beach, Blackpool | Wood | Sit Down | Operating | 1935 | 40 |
| Infusion | Pleasure Beach, Blackpool | Steel | Inverted | Operating | 2007 | 49.7 |
| Irn-Bru Revolution | Pleasure Beach, Blackpool | Steel | Sit Down | Operating | 1979 | 45 |
| Jubilee Odyssey | Fantasy Island | Steel | Inverted | Operating | 2002 | 63 |
| Jungle Coaster | Legoland Windsor | Steel | Sit Down | Operating | 2004 | 35 |
| Knightmare | Camelot Theme Park | Steel | Sit Down | Operating | 2007 | 43.5 |
| Kumali | Flamingo Land Theme Park & Zoo | Steel | Inverted | Operating | 2006 | 54.9 |
| Magic Mouse | Brean Leisure Park | Steel | Sit Down | Operating | 2007 | 29.1 |
| Megafobia | Oakwood Theme Park | Wood | Sit Down | Operating | 1996 | 48 |
| Millennium Roller Coaster | Fantasy Island | Steel | Sit Down | Operating | 1999 | 55.9 |
| Nemesis | Alton Towers | Steel | Inverted | Operating | 1994 | 50 |
| Nemesis Inferno | Thorpe Park | Steel | Inverted | Operating | 2003 | 47.8 |
| New Roller Coaster | New MetroLand | Steel | Sit Down | Operating | 1988 | 26.8 |
| Oblivion | Alton Towers | Steel | Sit Down | Operating | 1998 | 68 |
| Pepsi Max Big One | Pleasure Beach, Blackpool | Steel | Sit Down | Operating | 1994 | 74 |
| Rage | Adventure Island | Steel | Sit Down | Operating | 2007 | 43.5 |
| Rat | Loudoun Castle | Steel | Sit Down | Operating | 2005 | 28 |
| Rattlesnake | Chessington World of Adventures | Steel | Sit Down | Operating | 1998 | 28 |
| Rhino Coaster | West Midlands Safari Park | Steel | Sit Down | Operating | 1992 | 28.5 |
| Rita - Queen of Speed | Alton Towers | Steel | Sit Down | Operating | 2005 | 61.1 |
| Roller Coaster | Great Yarmouth Pleasure Beach | Wood | Sit Down | Operating | 1932 | 45 |
| Roller Coaster | Pleasure Beach, Blackpool | Wood | Sit Down | Operating | 1933 | 35 |
| Roller Coaster | Wicksteed Park | Steel | Sit Down | Operating | 2000 | 28 |
| Shockwave | Drayton Manor Park | Steel | Stand Up | Operating | 1994 | 53 |
| Speed: No Limits | Oakwood Theme Park | Steel | Sit Down | Operating | 2006 | 59 |
| Stealth | Thorpe Park | Steel | Sit Down | Operating | 2006 | 80 |
| Tornado | M&Ds Scotland's Theme Park | Steel | Sit Down | Operating | 1998 | 44.7 |
| Tsunami | M&Ds Scotland's Theme Park | Steel | Inverted | Operating | 2004 | 38 |
| Twist and Shout | Loudoun Castle | Steel | Sit Down | Operating | 2003 | 41 |
| Twister | Lightwater Valley | Steel | Sit Down | Operating | 2001 | 29.1 |
| Ultimate | Lightwater Valley | Steel | Sit Down | Operating | 1991 | 50 |
| Vampire | Chessington World of Adventures | Steel | Suspended | Operating | 2002 | 45 |
| Velocity | Flamingo Land Theme Park & Zoo | Steel | Sit Down | Operating | 2005 | 54 |
| Wall's Twister Ride | West Midlands Safari Park | Steel | Sit Down | Operating | 1998 | 29.1 |
| Whirlwind | Camelot Theme Park | Steel | Sit Down | Operating | 2003 | 37.3 |
| Wild Mouse | Flamingo Land Theme Park & Zoo | Steel | Sit Down | Operating | 1997 | 28 |
| Wipeout | Pleasurewood Hills | Steel | Sit Down | Operating | 2007 | 47 |
| X:\ No Way Out | Thorpe Park | Steel | Sit Down | Operating | 1996 | 27.7 |
<colgroup><col><col><col><col><col><col><col></colgroup><tbody>
</tbody>