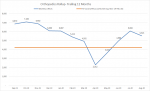
I am exporting Excel charts to PowerPoint - The upper right section with the, % of Pre-COVID, the green arrow, and the Pre-Covid 325, are in a text box. The green arrow is inserted and won't export to the PowerPoint Slide. The items in the text boxes are exporting to PowerPoint for all but 6 tabs at the end of the workbook and I don't see any difference in the charts. I have checked to make sure the text boxes are in the chart - they are - but beyond that I don't understand why they aren't exporting like the other tabs - can anyone help? The first one shown works, then second chart doesn't export the text boxes (graph exports fine). Thank you!
This exports everything except the green arrow (it is an inserted shape)

This is the PowerPoint Slide

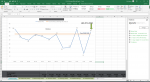
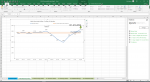
This does not Export the (93% of Pre-COVID), (Green Arrow), or (Pre-COVID 1,857) Text Boxes?


This exports everything except the green arrow (it is an inserted shape)
This is the PowerPoint Slide
This does not Export the (93% of Pre-COVID), (Green Arrow), or (Pre-COVID 1,857) Text Boxes?
")


