Extract data from an existing Line Chart, from one workbook to the Chart workbook

Corried

Board Regular
Joined
Dec 19, 2019
Messages
217
Office Version
  1. 2019
Platform
  1. Windows
  2. Web
How to automatically extract data from an existing CHART, from one workbook "Example: GDP_Annual_Growth_Rate_%.xlm" to the CHART workbook "Example: PMI.xlm". Using VBA in excel.

Now, the worksheets data in each workbook is name after a country.

Example Below:

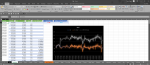
How can VBA extract data from worksheet #8: "Australia" in GDP_Annual_Growth_Rate_%.xlm workbook. To worksheet #2: "Australia" in PMI.xlm workbook Chart.


Note:

  1. GDP_Annual_Growth_Rate_%.xlm workbook, have 185 worksheet. Each named after a country.and
  2. PMI.xlm workbook, have 51 worksheet. Each named after a country
Please view files below if you are willing to help me.

Thanks in advance

Cheer

PMI.xlsm

GDP_Annual_Growth_Rate_%.xlsm
 
Ok. Thanks for your openness...

Now There are two photos:
  1. Australia- PMI. Which represents PMI.xlsm workbook and
  2. Afghanistan-GDP. Which represents GDP Annual Growth Rate %.xlsm
Now

Australia- PMI Workbook have 51 worksheet. Each named after a country beginning with "Australia" worksheet #2 and
Afghanistan-GDP worksheet have 185 worksheet. Each named after a country beginning with "Afghanistan" worksheet #2.

The question is: How can I extract or grab the correct worksheet name and ranges ranges from GDP Annual Growth Rate %.xlsm workbook and paste it into the line chart?
Example:
Copy ranges from workbook "GDP Annual Growth Rate %.xlsm", worksheet #8 "Australia" and
Paste ranges into line chart in workbook "PMI.xlsm" worksheet #2

How can I accomplish this?

Thanks in advance
 

Attachments

  • Australia- PMI.PNG
    Australia- PMI.PNG
    199.4 KB · Views: 5
  • Afghanistan-GDP.PNG
    Afghanistan-GDP.PNG
    63.5 KB · Views: 5
Upvote 0

Excel Facts

Highlight Duplicates
Home, Conditional Formatting, Highlight Cells, Duplicate records, OK to add pink formatting to any duplicates in selected range.
You know that's a stacked line chart in the PMI chart? % Change is stacked on Last (or under, when it's negative), and the rolling average is stacked on that. Maybe it's what you want, but usually stacked line charts are used by accident, when someone really wanted a regular line chart.

Is that the PMI worksheet, or the Australia worksheet, that's highlighted in the Autralia-PMI.PNG image?

You want to copy the data from the GDP workbook, Australia worksheet, and paste it into the PMI workbook, but which tab in the PMI workbook? I had originally thought the Australia tab, but I'm not sure if it's the PMI tab. Might not even use Copy-Paste, but the data will be moved over.
 
Upvote 0
Is that the PMI worksheet, or the Australia worksheet, that's highlighted in the Australia-PMI.PNG image?
It is the PMI workbook in Australia worksheet...

Quote: "You want to copy the data from the GDP workbook, Australia worksheet, and paste it into the PMI workbook, but which tab in the PMI workbook?"


Thanks right. I want to copy the data from the GDP workbook, Australia worksheet, and paste it into the PMI workbook, Australia worksheet... Chart.
However, also how can I achieve this for the rest of this countries?

Thanks for your patience with me...
 
Upvote 0
It is the PMI workbook in Australia worksheet...

Quote: "You want to copy the data from the GDP workbook, Australia worksheet, and paste it into the PMI workbook, but which tab in the PMI workbook?"


Thanks right. I want to copy the data from the GDP workbook, Australia worksheet, and paste it into the PMI workbook, Australia worksheet... Chart.
However, also how can I achieve this for the rest of this countries?

Thanks for your patience with me...
You keep saying "the data", which isn't very specific. No cell addresses or column labels or other descriptions.

Pretend I'm 8 years old. Which data from which cells in worksheet A to which cells in worksheet B. Does the data get appended to the existing data, or placed adjacent to it? Is it plotted in the same series in the chart or as a new series. These are things you must know intuitively but you're not getting them across.
 
Upvote 0
Ok.

Steps

I want to opened GDP_Annual_Growth_Rate_%.xlsm workbook to copy the ranges from column "B" & "C"in each worksheet one at a time. and paste the ranges into PMI.xlsm, workbook, into each worksheet using the same existent chart.

Here are a few examples:

Copy Ranges from column "B" & "C"from : GDP_Annual_Growth_Rate_%.xlsm Worksheet #8 name:"Australia".

Next

Paste Ranges to PMI.xlsm, Worksheet #2 name:"Australia", into existent chart.


The example above should be carried out with the rest of worksheets, once the worksheet name is available in the other workbook.


I must say Jon Peltier. you are a patience fellow.

Thanks for everything. Hoping that the problem can be found soon.

Thanks
 
Upvote 0
Pasted into the chart directly, not into the worksheet first? External links can be tricky in a chart. For example, when you close the GDP workbook, the charts in the PMI workbook will be broken. The data is there, but no longer plotted correctly along the date axis.

But anyway, here's a simple routine which does a little checking as it proceeds. Paste this into a new module. The model can reside wherever is convenient, in one of the two workbooks we're using, another workbook, or an add-in.

VBA Code:
Option Explicit

Const SourceName As String = "GDP_Annual_Growth_Rate_%.xlsm"
Const TargetName As String = "PMI.xlsm"

Sub DataFromOneWorkbookToAnother()
  On Error Resume Next
  Dim wbSource As Workbook
  Set wbSource = Workbooks(SourceName)
  If wbSource Is Nothing Then
    Dim ErrorMessage As String
    ErrorMessage = "Please open workbook '" & SourceName & "'"
    GoTo ErrorExit
  End If
  Dim wbTarget As Workbook
  Set wbTarget = Workbooks(TargetName)
  If wbTarget Is Nothing Then
    ErrorMessage = "Please open workbook '" & TargetName & "'"
    GoTo ErrorExit
  End If
  On Error GoTo 0
 
  Dim ws As Worksheet
  For Each ws In wbTarget.Worksheets
    If ws.Name <> "PMI" Then
      On Error Resume Next
      Dim wsSource As Worksheet
      Set wsSource = wbSource.Worksheets(ws.Name)
      On Error GoTo 0
      If wsSource Is Nothing Then
        Dim MissingSheetList As String
        If Len(MissingSheetList) = 0 Then
          MissingSheetList = "These worksheets were not found in '" & SourceName & "':" & vbNewLine
        End If
        MissingSheetList = MissingSheetList & ws.Name & vbNewLine
      Else
        Dim cht As Chart
        On Error Resume Next
        Set cht = ws.ChartObjects(1).Chart
        On Error GoTo 0
        If cht Is Nothing Then
          Dim MissingChartList As String
          If Len(MissingChartList) = 0 Then
            MissingChartList = "These worksheets in '" & TargetName & "' did not have a chart:" & vbNewLine
          End If
          MissingChartList = MissingChartList & ws.Name & vbNewLine
        Else
          With wsSource
            Dim XValues As Range
            Set XValues = .Range(.Range("B3"), .Range("B3").End(xlDown))
            Dim YValues As Range
            Set YValues = XValues.Offset(, 1)
          End With
          With cht.SeriesCollection.NewSeries
            .Values = YValues
            .XValues = XValues
            .Name = "Added Series"
            .ChartType = xlXYScatterLinesNoMarkers
            .AxisGroup = xlPrimary
          End With
          Set cht = Nothing
        End If
      End If
      Set wsSource = Nothing
    End If
  Next
 
ExitSub:
  If Len(MissingSheetList) Then
    MsgBox MissingSheetList, vbExclamation, "Missing Sheets"
    Debug.Print MissingSheetList
  End If
  If Len(MissingChartList) Then
    MsgBox MissingChartList, vbExclamation, "Missing Charts"
    Debug.Print MissingChartList
  End If
 
  Exit Sub
 
ErrorExit:
  MsgBox ErrorMessage, vbCritical, "ERROR"
  GoTo ExitSub
End Sub
 
Upvote 0
Wow. I really, really appreciate the effort, the patience and the time you take, working with me. I know I can be annoying sometime with my explanations, but you work it through. I have completed your tuition. However, I am not sure if you will say no, I just don't know. If you reject the comment. I will understand. I will not nag you no more.

I have made a little change on the "ChartType" & "AxisGroup". See photo below.


My problem here is this. If you are open... How can I get the dates to match the beginning of the line chart and the ending or nearest date?

This are for all the worksheets. Thanks in advance
 

Attachments

  • Change ChatType & AxisGroup.PNG
    Change ChatType & AxisGroup.PNG
    156.4 KB · Views: 6
Upvote 0
Did my added series not plot properly? I didn't ask how is should be plotted, I assumed another series with a line.

If what you changed it to makes it the way you want, that's great. But don't forget the code I provided.
 
Upvote 0
Did my added series not plot properly?
Jon Peltier Code.PNG


The above code is your. The problem with this, "GDP_Annual_Growth_Rate_%.xlsm" Time fame have push the balance of the series to the right hand side as " GDP_Annual_Growth_Rate_%.xlsm " time series have begin before the other time series.


Now. I have change " GDP_Annual_Growth_Rate_%.xlsm " series from a line to a column chart. The problem I'm facing is this:
How can I get the dates to match the beginning of the line chart and the ending or nearest date?

See my error below.
Change ChatType & AxisGroup.PNG


Thanks in advance


Upvote 0

Forum statistics

Threads
1,214,819
Messages
6,121,741
Members
449,050
Latest member
excelknuckles

We've detected that you are using an adblocker.

We have a great community of people providing Excel help here, but the hosting costs are enormous. You can help keep this site running by allowing ads on MrExcel.com.
Allow Ads at MrExcel

Which adblocker are you using?

Disable AdBlock

Follow these easy steps to disable AdBlock

1)Click on the icon in the browser’s toolbar.
2)Click on the icon in the browser’s toolbar.
2)Click on the "Pause on this site" option.
Go back

Disable AdBlock Plus

Follow these easy steps to disable AdBlock Plus

1)Click on the icon in the browser’s toolbar.
2)Click on the toggle to disable it for "mrexcel.com".
Go back

Disable uBlock Origin

Follow these easy steps to disable uBlock Origin

1)Click on the icon in the browser’s toolbar.
2)Click on the "Power" button.
3)Click on the "Refresh" button.
Go back

Disable uBlock

Follow these easy steps to disable uBlock

1)Click on the icon in the browser’s toolbar.
2)Click on the "Power" button.
3)Click on the "Refresh" button.
Go back
Back
Top