Bender1964
New Member
- Joined
- Aug 3, 2020
- Messages
- 5
- Office Version
- 2007
- Platform
- Windows
Hi, first timer on this site. I run a local darts comp here in Australia, and 99% of what we do uses an Excel spreadsheet. We score on Excel, and also keep a running tally of the current seasons wins and losses by players to give us a ranked table. We have many seasons of data available in the form of an all seasons combined results table which lists the 2 players per games names side by side in columns and the points they scored in that game in the next 2 columns. What I would like to achieve is to sort through the table of results to produce a running total of wins and losses for each player against other particular players. This would allow us to know who has the best results against certain players etc.
I have attached a very small screenshot of our historical table. As per the attached table, the players names are in columns A & B, and the score for player 1 is in column C, and the score for player 2 is in column D. As an example, I would like to search through that table to find out how many times Dave Gibson has played Noel McCudden. This would give me a game total between the 2 players. I would then like to search through the sorted results to see how many times in these sorted games was Dave Gibson's score greater than 0 (greater than 0 is a win). This would then provide total games played between the 2 players, and a winning % for both of them against each other. I would then roll this out across all players.
Any help or suggestions are appreciated. I have been trying INDEX & MATCH, but I really don't understand it well enough. I have enough issues with VLOOKUP !!
Thanks Peter
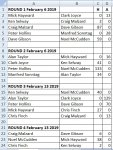
") Hopefully. I just noticed i #1 image, that OP has listed an H and A, as it was games, Home and Away!
Hopefully. I just noticed i #1 image, that OP has listed an H and A, as it was games, Home and Away!


