Find the Distinct Count of most common day for products used by day of the week (1-7) distinct count

zgoldflo

New Member
Joined
Dec 13, 2021
Messages
30
Office Version
  1. 365
Platform
  1. Windows
I have bike share data that indicates the day of the week a bike was used in number format 1-7 (indicates days of the week). I want to figure out the most common days of the week a specific route was most popular i.e. for each specific route which (number or) day was most common. I believe what I need to do is a distinct count. I have organized my data into a pivot table for the top ten monthly routes. I want to figure out throughout the month, which day of the week was most common for each route.

I have tried to get a distinct count, but for some reason, that option is grayed out and does not let me select it within the Pivot Table.

Here is the Pivot Table.

_12_2020.xlsx
H
10
Dec_2020_pt


Here is the source data.

_12_2020.xlsx
I
700:22:34
Dec_2020


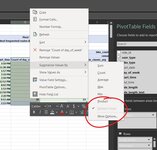
Below is an image of the Distinct Count being grayed as an option in my Pivot Table
 

Attachments

  • Screenshot 2021-12-31 085912.jpg
    Screenshot 2021-12-31 085912.jpg
    111.2 KB · Views: 11

Excel Facts

Get help while writing formula
Click the italics "fx" icon to the left of the formula bar to open the Functions Arguments dialog. Help is displayed for each argument.
Hi

Distinct count can only be used with a datamodel pivot table.
But you can't change a normal pivot table into a datamodel pivot table - you have to create it from scratch.
 
Upvote 0
Hi. What about the formula or ability to do that from the source data?

Also not sure what the difference is between the two pivot table mentioned above.
 
Upvote 0
So change the source data into a table? Then distinct count will do the trick for me?
 
Upvote 0
That was a question.

If I change the data source into a Table, create a Pivot Table from there, will I be able to then use Distinct Count to be able to solve the above question I asked?
 
Upvote 0
It seems to me you didn't follow my links and read the articles and viewed the picture.

An Excel table is always a good start but it does not able discount count in a pivot table.
 
Upvote 0

Forum statistics

Threads
1,214,925
Messages
6,122,303
Members
449,078
Latest member
nonnakkong

We've detected that you are using an adblocker.

We have a great community of people providing Excel help here, but the hosting costs are enormous. You can help keep this site running by allowing ads on MrExcel.com.
Allow Ads at MrExcel

Which adblocker are you using?

Disable AdBlock

Follow these easy steps to disable AdBlock

1)Click on the icon in the browser’s toolbar.
2)Click on the icon in the browser’s toolbar.
2)Click on the "Pause on this site" option.
Go back

Disable AdBlock Plus

Follow these easy steps to disable AdBlock Plus

1)Click on the icon in the browser’s toolbar.
2)Click on the toggle to disable it for "mrexcel.com".
Go back

Disable uBlock Origin

Follow these easy steps to disable uBlock Origin

1)Click on the icon in the browser’s toolbar.
2)Click on the "Power" button.
3)Click on the "Refresh" button.
Go back

Disable uBlock

Follow these easy steps to disable uBlock

1)Click on the icon in the browser’s toolbar.
2)Click on the "Power" button.
3)Click on the "Refresh" button.
Go back
Back
Top