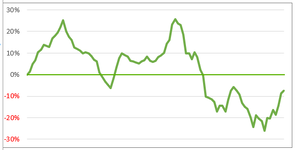
Formatting zero horizonal axis line on charts

leojez

Board Regular
Joined
Apr 12, 2022
Messages
51
Office Version
  1. 365
Platform
  1. Windows
Hello,

I have the following chart:

1659772592088.png


I'd love to be able to format the 0% axis line, so it is slightly thicker and, if possible, a different color. The ideal end result would be:

1659772777576.png


I can't seem to find any way to do this. Doable? Thanks.
 

Attachments

  • 1659772752580.png
    1659772752580.png
    128 KB · Views: 3

Excel Facts

VLOOKUP to Left?
Use =VLOOKUP(A2,CHOOSE({1,2},$Z$1:$Z$99,$Y$1:$Y$99),2,False) to lookup Y values to left of Z values.

Forum statistics

Threads
1,214,639
Messages
6,120,679
Members
448,977
Latest member
dbonilla0331

We've detected that you are using an adblocker.

We have a great community of people providing Excel help here, but the hosting costs are enormous. You can help keep this site running by allowing ads on MrExcel.com.
Allow Ads at MrExcel

Which adblocker are you using?

Disable AdBlock

Follow these easy steps to disable AdBlock

1)Click on the icon in the browser’s toolbar.
2)Click on the icon in the browser’s toolbar.
2)Click on the "Pause on this site" option.
Go back

Disable AdBlock Plus

Follow these easy steps to disable AdBlock Plus

1)Click on the icon in the browser’s toolbar.
2)Click on the toggle to disable it for "mrexcel.com".
Go back

Disable uBlock Origin

Follow these easy steps to disable uBlock Origin

1)Click on the icon in the browser’s toolbar.
2)Click on the "Power" button.
3)Click on the "Refresh" button.
Go back

Disable uBlock

Follow these easy steps to disable uBlock

1)Click on the icon in the browser’s toolbar.
2)Click on the "Power" button.
3)Click on the "Refresh" button.
Go back
Back
Top