Honor Oak Bloke
New Member
- Joined
- Jan 9, 2012
- Messages
- 1
Hi,
I am trying to use conditional formatting to highlight different % ranges in cells. To explain:
I have a grid of data with name of entity down the left vertical axis and 5 different time periods along the horizontal axis. This means be looking at entity A and time period 1 Day I can see that this is showing a daily movement of -4.63%. For entity B -3.98% and so on. I am using a traffic light system to show when entities reach 'tipping points', for example if any entity is less than -5% in one day it would be amber, less than -10% red and greater than -5% green. The problem is that these are static limits and dont take into account the volatilty of the movements. I want this grid to show the outliers in a given period, however at present if all the entitys are greater than the static limit they are all red and so any outliers are not immediately clear.
Ideally I would like the conditional formatting to look at the standard deviation of the average and use a traffic light system based on 1, 1.5 and 2 standard deviations away from the average (this is all calculated seperately). Is it possible to factor external calculations into the conditional formatting calculation (or to insert this into the formula bar on the conditional formatting set up)?
Apologies for the rambling explanation, please ask any questions that might clarify any of the points above.
HOB
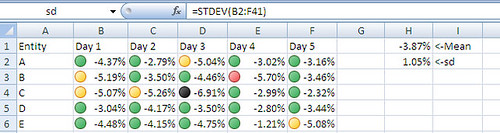
I am trying to use conditional formatting to highlight different % ranges in cells. To explain:
I have a grid of data with name of entity down the left vertical axis and 5 different time periods along the horizontal axis. This means be looking at entity A and time period 1 Day I can see that this is showing a daily movement of -4.63%. For entity B -3.98% and so on. I am using a traffic light system to show when entities reach 'tipping points', for example if any entity is less than -5% in one day it would be amber, less than -10% red and greater than -5% green. The problem is that these are static limits and dont take into account the volatilty of the movements. I want this grid to show the outliers in a given period, however at present if all the entitys are greater than the static limit they are all red and so any outliers are not immediately clear.
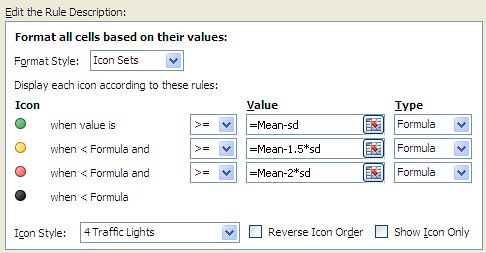
Ideally I would like the conditional formatting to look at the standard deviation of the average and use a traffic light system based on 1, 1.5 and 2 standard deviations away from the average (this is all calculated seperately). Is it possible to factor external calculations into the conditional formatting calculation (or to insert this into the formula bar on the conditional formatting set up)?
Apologies for the rambling explanation, please ask any questions that might clarify any of the points above.
HOB