Getting the values from a curve

nickdf

New Member
Joined
Jun 14, 2022
Messages
3
Office Version
  1. 365
Platform
  1. Windows
Hi

I'd like to put together some pricing for products, with lower prices for volume.

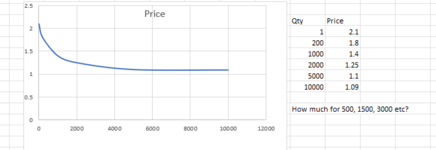
If plotted with volume on an X axis and price on Y, this would give me a curve a bit like the bottom left quarter of a flattened oval.

I don't have the maths skills to work out a formula that gives me the curve I want, where I can specify how steep it is, how quickly it bottoms out as we get near cost price etc. So my idea was to plot a curve in Excel using certain data points, and then extract the price from the curve by seeing if Excel could give me the values along its length.

I found some VBA code to extract data from a chart, but if only gives the values I've put in to my source data - it doesn't allow me to get the values in between, i.e. along the entire length of the curve.

Any suggestions please?

Thanks in advance
 

Attachments

  • Capture.PNG
    Capture.PNG
    10.6 KB · Views: 21
So I am not a mathematician and was looking for a simple approach. As I interpreted KRice's response, in layman's terms you find the nearest two data points to the ones you've got (one higher, one lower) and if you've got enough data points then you assume a straight line exists between each, rather than a curve. You then just need to work out how far along that straight line your value of interest is, and use a linear calculation to get your answer.

e.g. in your case you have values for 4.35 and 6, and so to calculate the value for 5 you need the value 0.65/1.65=39.39%.

Now apply the 39.39% to the difference between (16400-11760) * 0.3939 = 1827.88

As your curve is going down, subtract from the higher number: 16400 - 1827.88 = 14572.12

It's not exact, as we're assuming the curve is made up of smaller straight lines in order to get a number, but for my purposes it was accurate enough. You can manually add more data points by inspecting your graph if you need to, which will increase the accuracy of this approach for getting values near those data points..
 
Upvote 0

Excel Facts

When they said...
When they said you are going to "Excel at life", they meant you "will be doing Excel your whole life".
Welcome to the MrExcel board! It probably would be better if your question originated in its own thread to draw more attention to it. And within that new thread, you could link to this thread and mention anyone who contributed to it as a way to notify them. Then the discussion is less likely to become confusing.

About your question...without details of the functional relationship between radius and load, I would examine a plot of one against the other and note that load appears to monotonically decrease with increasing radius. You could try some basic regression models to see how well they fit the real data. Most of those built in to Excel do not yield a very good fit, but a power law curve offers a reasonably good fit. However, the power law fit may not be good enough for your purposes: note that it appears to be about 10 % high for a radius of 2.9 m. In this case, I would probably opt for cubic spline interpolation. You can find VBA code for this, install an add-in with that functionality, use a different software package altogether, or cobble something together to perform the analysis. I've done the latter below. The cubic spline interpolation consists of a piecewise series of polynomial curves of degree 3 or less. The curves pass through each known data point. In practice, we want to determine the coefficients of these piecewise curves, and then when we perform an interpolation to estimate the load at some radius, we use the relevant polynomial that connects to the points that bound our x (load) value. Still, I would recommend plotting the actual data against the spline curves to identify any potential issues. In this case, there are two. A plot (the first/left plot) of known data is shown (blue circles) and a power law curve determined by regression is also shown (dotted blue). A cubic spline curve is shown in red...and we see an undesirable characteristic between a radius of 2.9 m and 4.35 m. Also note that the behavior between 4.35 m and 6 m is problematic, as the spline appears to be slightly concave down (when we really want concave up). The steep descent from 80000+ kg for a radius of 1 m is responsible for this. One work-around is to avoid the first data point altogether (which you've done in your original post). If we eliminate the 1st data point, we see (second/right plot) the power law regression (dotted blue) is slightly worse, while the cubic spline inflections are eliminated and create well-behaved curve segments passing through the known data points.

The file used to generate these plots is linked to below. Worksheet Governex1 performs the analysis for the 1st plot, and worksheet Governex2 is used for the 2nd. For interpolations between 2.9 m and 16.15 m, I would use Governex2. On that sheet (purple cells), is the section where the actual interpolation occurs. For any given x value, the appropriate spline polynomial coefficients are identified and used to estimate a y value. One other quick comment...I've assumed the "1.75" data point is actually supposed to be 11.75. As a point of comparison, for a radius of 5 m, the Governex2 cubic spline interpolation returns 14299 kg.

1661367619717.png
1661368533192.png

 
Upvote 0

Forum statistics

Threads
1,214,911
Messages
6,122,195
Members
449,072
Latest member
DW Draft

We've detected that you are using an adblocker.

We have a great community of people providing Excel help here, but the hosting costs are enormous. You can help keep this site running by allowing ads on MrExcel.com.
Allow Ads at MrExcel

Which adblocker are you using?

Disable AdBlock

Follow these easy steps to disable AdBlock

1)Click on the icon in the browser’s toolbar.
2)Click on the icon in the browser’s toolbar.
2)Click on the "Pause on this site" option.
Go back

Disable AdBlock Plus

Follow these easy steps to disable AdBlock Plus

1)Click on the icon in the browser’s toolbar.
2)Click on the toggle to disable it for "mrexcel.com".
Go back

Disable uBlock Origin

Follow these easy steps to disable uBlock Origin

1)Click on the icon in the browser’s toolbar.
2)Click on the "Power" button.
3)Click on the "Refresh" button.
Go back

Disable uBlock

Follow these easy steps to disable uBlock

1)Click on the icon in the browser’s toolbar.
2)Click on the "Power" button.
3)Click on the "Refresh" button.
Go back
Back
Top