Graph Axis Million and Thousand

shansakhi

Active Member
Joined
Apr 5, 2008
Messages
276
Office Version
  1. 365
Platform
  1. Windows
Hello,
Hope all are fine and safe.
I need your assistance for below.
I always come across a situation where I have a few Revenue Numbers in Millions Unit, a Parts number inn Thousand Unit and Rate is in normal unit.
Currently while creating the graph I use secondary access for Rate numbers but for Millions and Thousand Unit, no choice but I have to use only axis. Due this my thousand number bar in graph shows either a thin line or invisible.
Can you please assist me to play with Axis where I can show Revenue Numbers in Millions , Part Numbers in Thousands and Fare in Normal and all visible properly.
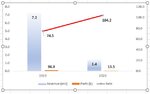
YearRevenue (mn)Parts (k)Rate
2019​
7.296.974.5
2020​
1.413.5104.2

Please Assist.

Thank you
Shan
 

Attachments

  • 2019 vs 2020.JPG
    2019 vs 2020.JPG
    28 KB · Views: 23

Excel Facts

Wildcard in VLOOKUP
Use =VLOOKUP("Apple*" to find apple, Apple, or applesauce
If you select the axis which contains the number you want to format and hit CTRL+1 to format the axis, you have the option to show the axis on a logarithmic scale as per below which should enable you to show all values on the one axis

1603108626888.png
 
Upvote 0
Hi

I'm not a fan of posting several series referring to different things, may get confusing, but to answer the question...

With the values you posted I'd use revenue in one axis and both rate and parts (divided by 1000) in the other axis.

You'd have for the second axis the ranges 13.5-96.9 and 74.5-104.2 which would display all right in the 0-120 axis

You can add the axis title "Rate / Parts (k)" to make it clear that parts are in thousands.


cht01.jpg


As I said, it may be somehow confusing.
Another option is for ex. to make 3 charts and display them side by side.
 
Upvote 0
Hi

I'm not a fan of posting several series referring to different things, may get confusing, but to answer the question...

With the values you posted I'd use revenue in one axis and both rate and parts (divided by 1000) in the other axis.

You'd have for the second axis the ranges 13.5-96.9 and 74.5-104.2 which would display all right in the 0-120 axis

You can add the axis title "Rate / Parts (k)" to make it clear that parts are in thousands.


View attachment 24476


As I said, it may be somehow confusing.
Another option is for ex. to make 3 charts and display them side by side.
This is also a good way to showcase but little confusing as you correctly mentioned. Thank you for your assistance.
 
Upvote 0

Forum statistics

Threads
1,214,587
Messages
6,120,406
Members
448,958
Latest member
Hat4Life

We've detected that you are using an adblocker.

We have a great community of people providing Excel help here, but the hosting costs are enormous. You can help keep this site running by allowing ads on MrExcel.com.
Allow Ads at MrExcel

Which adblocker are you using?

Disable AdBlock

Follow these easy steps to disable AdBlock

1)Click on the icon in the browser’s toolbar.
2)Click on the icon in the browser’s toolbar.
2)Click on the "Pause on this site" option.
Go back

Disable AdBlock Plus

Follow these easy steps to disable AdBlock Plus

1)Click on the icon in the browser’s toolbar.
2)Click on the toggle to disable it for "mrexcel.com".
Go back

Disable uBlock Origin

Follow these easy steps to disable uBlock Origin

1)Click on the icon in the browser’s toolbar.
2)Click on the "Power" button.
3)Click on the "Refresh" button.
Go back

Disable uBlock

Follow these easy steps to disable uBlock

1)Click on the icon in the browser’s toolbar.
2)Click on the "Power" button.
3)Click on the "Refresh" button.
Go back
Back
Top