Hi,
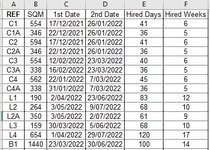
Does anyone know how to do Graphs with two dates. I'm trying to show e.g. 17/12/2021 to 26/01/22 to have as trending/lines period. I have two reference "554 SQM" & "C1". I can't seem to show it in a chart?
We have a great community of people providing Excel help here, but the hosting costs are enormous. You can help keep this site running by allowing ads on MrExcel.com.
Allow Ads at MrExcel
Which adblocker are you using?
Disable AdBlock
Follow these easy steps to disable AdBlock
1)Click on the icon in the browser’s toolbar. 2)Click on the icon in the browser’s toolbar. 2)Click on the "Pause on this site" option.
Go back
Disable AdBlock Plus
Follow these easy steps to disable AdBlock Plus
1)Click on the icon in the browser’s toolbar. 2)Click on the toggle to disable it for "mrexcel.com".
Go back
Disable uBlock Origin
Follow these easy steps to disable uBlock Origin
1)Click on the icon in the browser’s toolbar. 2)Click on the "Power" button. 3)Click on the "Refresh" button.
Go back
Disable uBlock
Follow these easy steps to disable uBlock
1)Click on the icon in the browser’s toolbar. 2)Click on the "Power" button. 3)Click on the "Refresh" button.