BRachui1973
New Member
- Joined
- May 12, 2022
- Messages
- 1
- Office Version
- 365
- Platform
- Windows
Hello-
I am having a time trying to find a way to develop a formula to monitor our daily schedule AND actual # of jobs/ work orders that are on our schedule each day, up to each work orders due date.
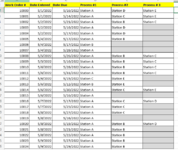
I attached a screenshot of a generic table.
We use Air Table to enter all of our Work Orders, so I will be pulling the data from there- once I get a working excel file.
As I mentioned, this is just a generic file- and not the file that I use daily.
Basically- what I need is the following:
- formula/ pivot table that will track what "processes" are on the schedule for each day-
- I need EACH Work Order # to show on the schedule for every day beginning with "Date Entered" and ending with "Date Due."
- I need this for each "Station " that is planned for each " Work Order"
For example-
Work Order # 10000 entered on 5/1/2022- and due on 5/16/2022 - and will need work completed at Station A, Station D, and Station E.
With that data- i need Work Order # 10000 to show up on the daily schedule for Station A, Station D, and Station E for each day from May 1 (Date Entered) through May 16. (Date Due)
The goal is to look at each day- and identify days that we are overloaded in any particular station, with potentially completing the work order for any given station on a "lighter" day between Date Entered and Date Due.
I appreciate anyone's assistance that can help me with this challenge.
One last request- once a method has been identified, then my next request will be to find a way to display it that is easy for others to read. ( Charts, graphs, etc)
I am having a time trying to find a way to develop a formula to monitor our daily schedule AND actual # of jobs/ work orders that are on our schedule each day, up to each work orders due date.
I attached a screenshot of a generic table.
We use Air Table to enter all of our Work Orders, so I will be pulling the data from there- once I get a working excel file.
As I mentioned, this is just a generic file- and not the file that I use daily.
Basically- what I need is the following:
- formula/ pivot table that will track what "processes" are on the schedule for each day-
- I need EACH Work Order # to show on the schedule for every day beginning with "Date Entered" and ending with "Date Due."
- I need this for each "Station " that is planned for each " Work Order"
For example-
Work Order # 10000 entered on 5/1/2022- and due on 5/16/2022 - and will need work completed at Station A, Station D, and Station E.
With that data- i need Work Order # 10000 to show up on the daily schedule for Station A, Station D, and Station E for each day from May 1 (Date Entered) through May 16. (Date Due)
The goal is to look at each day- and identify days that we are overloaded in any particular station, with potentially completing the work order for any given station on a "lighter" day between Date Entered and Date Due.
I appreciate anyone's assistance that can help me with this challenge.
One last request- once a method has been identified, then my next request will be to find a way to display it that is easy for others to read. ( Charts, graphs, etc)