Help required with graph

Paul at GTS

Board Regular
Joined
May 17, 2004
Messages
56
Office Version
  1. 365
Platform
  1. Windows
Hi all, I wonder if you can help me?

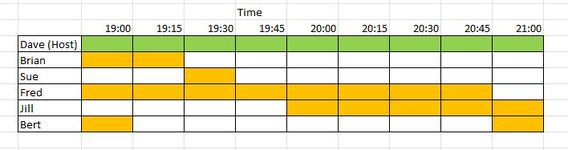
I keep a record of attendances for lectures and I wish to show the recorded attendances graphically based on time in the lecture.

As you will see on the attached image not all attendances are continuous blocks of time. I have the raw data showing this but I cannot figure out how to display it graphically.

Thanks
 

Attachments

  • Graph1.JPG
    Graph1.JPG
    32.8 KB · Views: 9

Excel Facts

Waterfall charts in Excel?
Office 365 customers have access to Waterfall charts since late 2016. They were added to Excel 2019.

Forum statistics

Threads
1,214,789
Messages
6,121,593
Members
449,038
Latest member
Arbind kumar

We've detected that you are using an adblocker.

We have a great community of people providing Excel help here, but the hosting costs are enormous. You can help keep this site running by allowing ads on MrExcel.com.
Allow Ads at MrExcel

Which adblocker are you using?

Disable AdBlock

Follow these easy steps to disable AdBlock

1)Click on the icon in the browser’s toolbar.
2)Click on the icon in the browser’s toolbar.
2)Click on the "Pause on this site" option.
Go back

Disable AdBlock Plus

Follow these easy steps to disable AdBlock Plus

1)Click on the icon in the browser’s toolbar.
2)Click on the toggle to disable it for "mrexcel.com".
Go back

Disable uBlock Origin

Follow these easy steps to disable uBlock Origin

1)Click on the icon in the browser’s toolbar.
2)Click on the "Power" button.
3)Click on the "Refresh" button.
Go back

Disable uBlock

Follow these easy steps to disable uBlock

1)Click on the icon in the browser’s toolbar.
2)Click on the "Power" button.
3)Click on the "Refresh" button.
Go back
Back
Top