Help to derive non-linear data point

jryan15

Board Regular
Joined
Jan 27, 2005
Messages
168
Hi all,

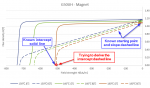
I've been working to try and derive equations of a non-linear data set in excel (trying to derive equation of dashed line). I've researched tons of methods using linest equations for log, hyperbolic, natural log, polynomial, etc, but I just can't get a line fit. To be more precise, I don't exactly need to derive the equation of the dashed line, I really just need to derive the x-intercept of the dashed line.

I won't have full data sets of the solids lines to work with though. I am able to calculate the items that I've drawn onto the photo in blue. If anyone can help or direct me to help, that would be fantastic! I could attach an excel file with data, but I can't figure out how, lol.

Thanks!
 

Attachments

  • B-H curve_edit.png
    B-H curve_edit.png
    39.7 KB · Views: 19

Excel Facts

Pivot Table Drill Down
Double-click any number in a pivot table to create a new report showing all detail rows that make up that number
I believe these curves are typically established by measurements, and the resulting data points are used to construct the curves. I doubt that a satisfactory functional description for the entire curve can be found, other than a spline fit that walks along the curve to construct piecemeal sections of the curve. If you have the measurements that created these magnetic hysteresis curves, the simplest approach would be to use the lower few points to find the coercivity point with linear extrapolation, provided you have confidence that you are on the linear part of the curve and that the extrapolation "distance" is relatively small.

Alternatively, you could resort to simulations based on thermodynamic theory, such as the Vectorial Incremental Nonconservative Consistent Hysteresis (VINCH) model developed by François-Lavet et al. (http://vincent.francois-l.be/VINCH_model.pdf). Sixdenier et al. describe an application of that approach to simulate hysteresis curves at various temperatures (https://hal.archives-ouvertes.fr/hal-01187711/document). This option is quite involved and probably only feasible if you need to thoroughly analyze the material's behavior.
 
Upvote 0
Thanks for the response. I feel like the curve is quite close to a hyperbolic function so I was hoping that there might be a mechanism to try and simulate the curve.
 
Upvote 0

Forum statistics

Threads
1,214,407
Messages
6,119,332
Members
448,888
Latest member
Arle8907

We've detected that you are using an adblocker.

We have a great community of people providing Excel help here, but the hosting costs are enormous. You can help keep this site running by allowing ads on MrExcel.com.
Allow Ads at MrExcel

Which adblocker are you using?

Disable AdBlock

Follow these easy steps to disable AdBlock

1)Click on the icon in the browser’s toolbar.
2)Click on the icon in the browser’s toolbar.
2)Click on the "Pause on this site" option.
Go back

Disable AdBlock Plus

Follow these easy steps to disable AdBlock Plus

1)Click on the icon in the browser’s toolbar.
2)Click on the toggle to disable it for "mrexcel.com".
Go back

Disable uBlock Origin

Follow these easy steps to disable uBlock Origin

1)Click on the icon in the browser’s toolbar.
2)Click on the "Power" button.
3)Click on the "Refresh" button.
Go back

Disable uBlock

Follow these easy steps to disable uBlock

1)Click on the icon in the browser’s toolbar.
2)Click on the "Power" button.
3)Click on the "Refresh" button.
Go back
Back
Top