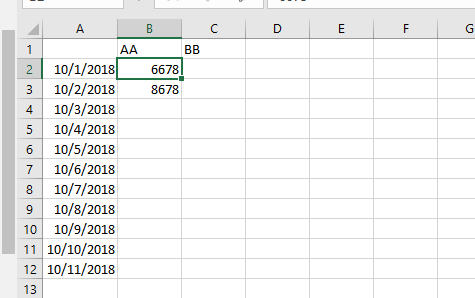
I would like to create a worksheet that includes pulls data for each fund, but one fund (i.e. AA Fund) at a time and for Net Purchases for fund total ($6,678.00 as of Oct 1, 2018). I would like to create a table that shows the time series.
For example, column A should be the date, 10/01/2018, 10/02/2018 and so on. Column B should be Net Purchase under fund total. I have 5 years of data for 16 funds. I tried INDEX/MATCH, but I couldn't figure it out. What formula could I put to pull the 6678 value under net purchase/fund total for AA fund as of Oct 1, and the next row in column B will pull 8678 value as of Oct 2? I am dire need of help.
<tbody>
</tbody>
For example, column A should be the date, 10/01/2018, 10/02/2018 and so on. Column B should be Net Purchase under fund total. I have 5 years of data for 16 funds. I tried INDEX/MATCH, but I couldn't figure it out. What formula could I put to pull the 6678 value under net purchase/fund total for AA fund as of Oct 1, and the next row in column B will pull 8678 value as of Oct 2? I am dire need of help.
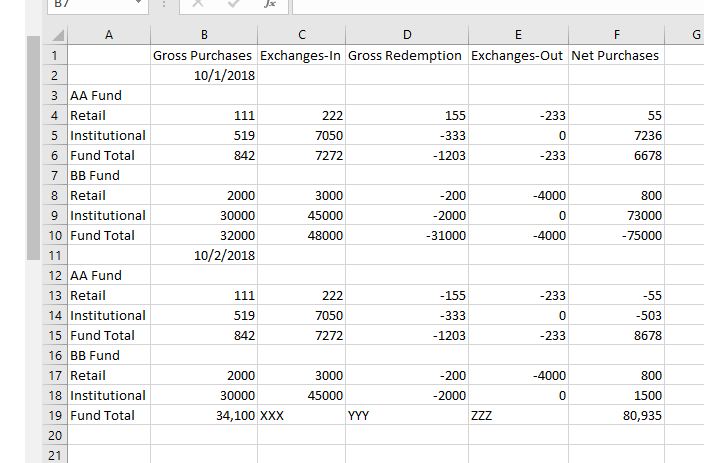
| 10/01/18 | ||||||
| Gross Purchases | Exchanges-In | Gross Redemption | Exchanges-Out | Net Purchases | ||
| AA Fund | ||||||
| Retail | 111 | 222 | 155 | -233 | 55 | |
| Institutional | 519 | 7050 | -333 | 0 | 7236 | |
| Fund Total | 842 | 7272 | -1203 | -233 | 6678 | |
| BB Fund | ||||||
| Retail | 2000 | 3000 | -200 | -4000 | 800 | |
| Institutional | 30000 | 45000 | -2000 | 0 | 73000 | |
| Fund Total | 32000 | 48000 | -31000 | -4000 | -75000 | |
| Oct 2, 2018 | ||||||
| AA Fund | ||||||
| Retail | 111 | 222 | -155 | -233 | -55 | |
| Institutional | 519 | 7050 | -333 | 0 | -503 | |
| Fund Total | 842 | 7272 | -1203 | -233 | 8678 | |
| BB Fund | ||||||
| Retail | 2000 | 3000 | -200 | -4000 | 800 | |
| Institutional | 30000 | 45000 | -2000 | 0 | 1500 | |
| Fund Total | 34,100 | XXX | YYY | ZZZ | 80,935 | |
<tbody>
</tbody>