Hi,
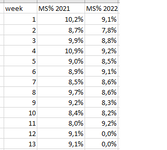
I have a pivot which contains values with percentages, the source data contains formulas with zero outcomes, this will be updated automatically with every period new data arrives. So these zeros will always be in the source data.
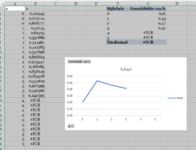
Now I'm trying to make a graph of the pivot but it shows zeros and I would like to hide them in a line graph.
How can I make the orange line stop at week 11 and not show the zeros? Workaround with formulas besides the pivot is also fine.


I have a pivot which contains values with percentages, the source data contains formulas with zero outcomes, this will be updated automatically with every period new data arrives. So these zeros will always be in the source data.
Now I'm trying to make a graph of the pivot but it shows zeros and I would like to hide them in a line graph.
How can I make the orange line stop at week 11 and not show the zeros? Workaround with formulas besides the pivot is also fine.
")


