How to make top 10 most and least combinations

yeno

New Member
Joined
Sep 2, 2022
Messages
4
Office Version
  1. 365
Platform
  1. Windows
Hi,

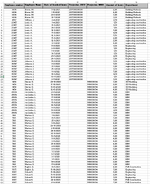
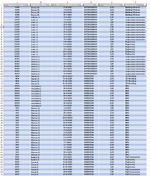
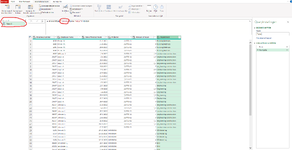
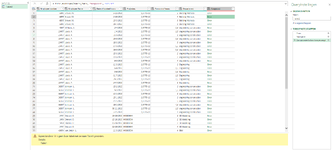
I have a dataset with the hours spent on different projects over the years 2020 and 2022 (about 150000 rows of data). The hours are tied to a person and each person is tied to a department. The columns of each row contain: a specific project number (two types of projectnumbers one start with 2877 and the other with M000), the persons name who has booked his hours on the project, the amount of hours the person has booked and to which department this person belongs.

I want to know wich combinations of departments within the projects occur the most and which the least (something like 10 most and 10 least), so from the data you can see which person has worked on which project and because this person is also tied to a department it should be possible to find out which departments collaborate most and least on projects. Anyone have any idea how I can find this?

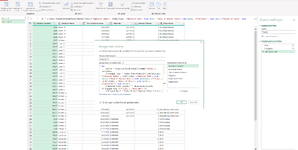
I have put a screenshot of the data.
 

Attachments

  • screenshot data.png
    screenshot data.png
    42 KB · Views: 10

Excel Facts

Square and cube roots
The =SQRT(25) is a square root. For a cube root, use =125^(1/3). For a fourth root, use =625^(1/4).
From your screenshot, it looks like you have the data on a sheet, but it is not in a table. The first step would be to get the data into a table: Create a Table in Excel. Tables open the door to a lot of options, and in general you should try to use them whenever possible.

Next, I am curious if it is possible to combine the "Projector - 2077" and "Projector - M00" columns. If you could consolidate those into one "Project" column, you will have an easier time with this.

Once you have done those two steps, it should be fairly easy to get your results with a Pivot Table or using Power Query. Both may sound intimidating, but are intuitive and easy to use. I'm happy to help if you get that far.
 
Upvote 0
From your screenshot, it looks like you have the data on a sheet, but it is not in a table. The first step would be to get the data into a table: Create a Table in Excel. Tables open the door to a lot of options, and in general you should try to use them whenever possible.

Next, I am curious if it is possible to combine the "Projector - 2077" and "Projector - M00" columns. If you could consolidate those into one "Project" column, you will have an easier time with this.

Once you have done those two steps, it should be fairly easy to get your results with a Pivot Table or using Power Query. Both may sound intimidating, but are intuitive and easy to use. I'm happy to help if you get that far.
Thank you for your reply and your help!
I have made the table and combined the two collomns of projects codes together, I attached a screenshot of it.

Some context (for if it wasn't clear):
In every project departments work together to finish the project. As you can see in the project M000894 the departments 3D modeling, BIM, Engineering and some others worked together. The department Engineering also worked on the project 287700000008, but with other departments than in the project M000894. What I am trying to do is find out which combinations of departments working together occur the most. There are preciclsy 654 of projects, so it is alot of data. I already made a PowerBI but couldnt find how to do it..

How can a pivot table or power query help, what do you suggest to do?
 

Attachments

  • screenshot data2.png
    screenshot data2.png
    41.3 KB · Views: 5
Upvote 0
This is a tricky one. How many Departments are there? Will other departments be added over time, or is the list fixed?

Also curious: do you want to know which EXACT combination happens the most (for instance: "3D Modeling, Engineering, and F&B" was the full team for 114 projects) OR do you want to know which two departments worked together the most (3D Modeling and Engineering worked on 590 common projects, so they are the two departments that worked together the most, regardless of what other departments were on those projects).
 
Last edited:
Upvote 0
Screenshot 2022-09-02 134103.png


If you are looking for Option #1 in the post above, here is some Power Query code that would accomplish it:

Power Query:
let
    Source = Excel.CurrentWorkbook(){[Name="Table1"]}[Content],
    #"Changed Type" = Table.TransformColumnTypes(Source,{{"Employee Number", Int64.Type}, {"Employee Name", type text}, {"Date of Booked Hours", type datetime}, {"Project", Int64.Type}, {"Amount of Hours", type number}, {"Department", type text}}),
    #"Removed Other Columns" = Table.SelectColumns(#"Changed Type",{"Project", "Department"}),
    #"Grouped Rows" = Table.Group(#"Removed Other Columns", {"Project"}, {{"Departments", each 
    (Text.Combine(List.Sort(List.Distinct([Department])), ", ")),
     type text}}),
    #"Sorted Rows" = Table.Sort(#"Grouped Rows",{{"Project", Order.Ascending}}),
    #"Grouped Rows1" = Table.Group(#"Sorted Rows", {"Departments"}, {{"Count", each Table.RowCount(Table.Distinct(_)), Int64.Type}}),
    #"Sorted Rows1" = Table.Sort(#"Grouped Rows1",{{"Count", Order.Descending}})
in
    #"Sorted Rows1"
 
Upvote 0
View attachment 73128

If you are looking for Option #1 in the post above, here is some Power Query code that would accomplish it:

Power Query:
let
    Source = Excel.CurrentWorkbook(){[Name="Table1"]}[Content],
    #"Changed Type" = Table.TransformColumnTypes(Source,{{"Employee Number", Int64.Type}, {"Employee Name", type text}, {"Date of Booked Hours", type datetime}, {"Project", Int64.Type}, {"Amount of Hours", type number}, {"Department", type text}}),
    #"Removed Other Columns" = Table.SelectColumns(#"Changed Type",{"Project", "Department"}),
    #"Grouped Rows" = Table.Group(#"Removed Other Columns", {"Project"}, {{"Departments", each
    (Text.Combine(List.Sort(List.Distinct([Department])), ", ")),
     type text}}),
    #"Sorted Rows" = Table.Sort(#"Grouped Rows",{{"Project", Order.Ascending}}),
    #"Grouped Rows1" = Table.Group(#"Sorted Rows", {"Departments"}, {{"Count", each Table.RowCount(Table.Distinct(_)), Int64.Type}}),
    #"Sorted Rows1" = Table.Sort(#"Grouped Rows1",{{"Count", Order.Descending}})
in
    #"Sorted Rows1"
To answer your question first:
1. This is a tricky one. How many Departments are there? Will other departments be added over time, or is the list fixed?
Amount of departments = 16 departments. And no, other departments wont be added over time.

2. And yes I want to know the exact combinations, so not just two departments.

But it seems that I am doing something wrong, I tried to implement the code you made but it wont work.
Because I am new to power query I dont know if I did it right. So I attached some screenshots and tried to explain step-by-step what I did.

Step-by-step how I did it:
I opened a new excel document without any data in it. Then clicked in the data tab on start power query editor > clicked on new source, followed the steps and added the table (see sreenshot named ''adding data'') > after this I clicked on custom column and copy pasted your code, but I got an error, saying that there is no excel table named table1.

In your code where it says table1, I changed that one time into table12 and another time into table2, because i think my table is called table12 or table2 (see screenshots), but with both changes it still gave the same error as with table1.

I am definitly doing something wrong do you know what?


Attachments

  • screenshot data3.png
    screenshot data3.png
    158.1 KB · Views: 3
  • screenshot data4.png
    screenshot data4.png
    132.4 KB · Views: 3
  • screenshot adding data.png
    screenshot adding data.png
    92.7 KB · Views: 3
  • screenshot data5.png
    screenshot data5.png
    171.9 KB · Views: 3
Upvote 0
To answer your question first:
1. This is a tricky one. How many Departments are there? Will other departments be added over time, or is the list fixed?
Amount of departments = 16 departments. And no, other departments wont be added over time.

2. And yes I want to know the exact combinations, so not just two departments.

But it seems that I am doing something wrong, I tried to implement the code you made but it wont work.
Because I am new to power query I dont know if I did it right. So I attached some screenshots and tried to explain step-by-step what I did.

Step-by-step how I did it:
I opened a new excel document without any data in it. Then clicked in the data tab on start power query editor > clicked on new source, followed the steps and added the table (see sreenshot named ''adding data'') > after this I clicked on custom column and copy pasted your code, but I got an error, saying that there is no excel table named table1.

In your code where it says table1, I changed that one time into table12 and another time into table2, because i think my table is called table12 or table2 (see screenshots), but with both changes it still gave the same error as with table1.

I am definitly doing something wrong do you know what?
I think the problem is that you are trying to use Custom Column to enter the code. What I have given you should be the entire code set in the Power Query.

To use my code, you want to use the Advanced Editor in Power query. It is located under the Home tab in the query section. Replace all of the code with my code from above, and make sure you are using the exact table name in the "Source" line ("Tabel2").

Alternatively, you can start a Power Query by right clicking on the source data table and choosing "Get Data from Table/Range". You could then open the Advanced Editor in Power query, and see how the Source line should read to access that table. Replace my source line with that one and go from there.

If you don't need just two departments, then the code above should be what you need (the other scenario is MUCH harder).
 
Upvote 0
I think the problem is that you are trying to use Custom Column to enter the code. What I have given you should be the entire code set in the Power Query.

To use my code, you want to use the Advanced Editor in Power query. It is located under the Home tab in the query section. Replace all of the code with my code from above, and make sure you are using the exact table name in the "Source" line ("Tabel2").

Alternatively, you can start a Power Query by right clicking on the source data table and choosing "Get Data from Table/Range". You could then open the Advanced Editor in Power query, and see how the Source line should read to access that table. Replace my source line with that one and go from there.

If you don't need just two departments, then the code above should be what you need (the other scenario is MUCH harder).
Your suggestions worked, I got the code right this time with no errors, but like you i didn't get a full table with combination but only two (see screenshots).
The code took the department of both projects and just counted those up, its different than the table you send some posts back..
Any idea whats wrong?
 

Attachments

  • screenshot data6.png
    screenshot data6.png
    61.4 KB · Views: 5
  • screenshot data7.png
    screenshot data7.png
    106.2 KB · Views: 5
Upvote 0

Forum statistics

Threads
1,214,575
Messages
6,120,344
Members
448,956
Latest member
Adamsxl

We've detected that you are using an adblocker.

We have a great community of people providing Excel help here, but the hosting costs are enormous. You can help keep this site running by allowing ads on MrExcel.com.
Allow Ads at MrExcel

Which adblocker are you using?

Disable AdBlock

Follow these easy steps to disable AdBlock

1)Click on the icon in the browser’s toolbar.
2)Click on the icon in the browser’s toolbar.
2)Click on the "Pause on this site" option.
Go back

Disable AdBlock Plus

Follow these easy steps to disable AdBlock Plus

1)Click on the icon in the browser’s toolbar.
2)Click on the toggle to disable it for "mrexcel.com".
Go back

Disable uBlock Origin

Follow these easy steps to disable uBlock Origin

1)Click on the icon in the browser’s toolbar.
2)Click on the "Power" button.
3)Click on the "Refresh" button.
Go back

Disable uBlock

Follow these easy steps to disable uBlock

1)Click on the icon in the browser’s toolbar.
2)Click on the "Power" button.
3)Click on the "Refresh" button.
Go back
Back
Top