3PlankWalker
Board Regular
- Joined
- Sep 18, 2014
- Messages
- 76
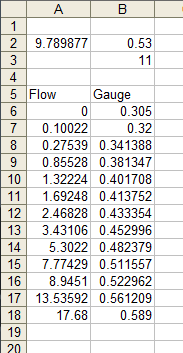
In Scattered Plot data is it possible to find Xvalue from the Yvalue.
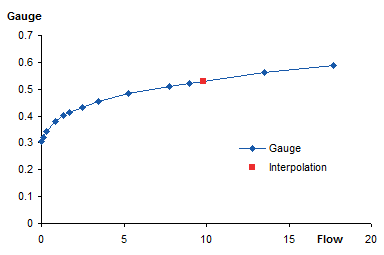
Here is the image of the Scattered Plot
 Image - TinyPic - Free Image Hosting, Photo Sharing & Video Hosting
Example Yvalue = 1000
Xvalue = 225
I Tried Excel XY Chart Variations with VBA
Interpolation But i Couldn't find Solution.
Thanks
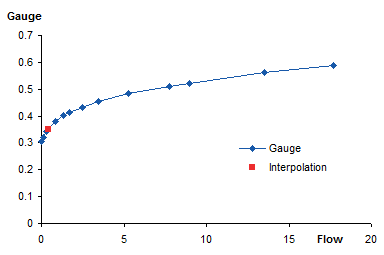
Here is the image of the Scattered Plot
Example Yvalue = 1000
Xvalue = 225
I Tried Excel XY Chart Variations with VBA
Interpolation But i Couldn't find Solution.
Thanks