Inspiration needed.... Excel chart visual aid

nparsons75

Well-known Member
Joined
Sep 23, 2013
Messages
1,254
Office Version
  1. 2016
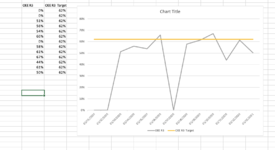
Hi, Im looking for some inspiration. I have a table / spreadsheet that I need to create charts or other forms of vision in order to drive focus to the areas which need it most.

Using the sheet: Excel File

The sheet is basically looking at 7 machines, R1, R2 etc...

Looking at R1 as an example, there are 4 elements, Performance, Quality, Availability and OEE. Each of these have a target (COL AB) and and actual AVG ALL (COL AE) COL AF shows the amount of improvement required to hit the target. Looking at the list I can see a real focus is required on R3 OEE, 30%.

The 3 elements making of the OEE 30% value also show to improve the 30% we need to focus on al 3 elements, 28%, 23% and 24%. If we can work on reducing these values to Zero, the OEE value will improve.

The idea of the sheet is to record the data but also drive focus to where it is needed.

I would like to create some charts or tables from the data to visually drive the focus.

Hope that makes sense..... appreciate any help.
 

Excel Facts

Does the VLOOKUP table have to be sorted?
No! when you are using an exact match, the VLOOKUP table can be in any order. Best-selling items at the top is actually the best.
the sheet is locked to a user and not public
have a look at XL2BB to post here - link in my signature and on the editing menu
 
Upvote 0
MREXCEL VERSION 1.xlsx
ABCDEFGHIJKLMNOPQRSTUVWXYZAAABACADAEAFAGAH
4KPIJan 20Feb 20Mar 20Apr 20May 20Jun 20Jul 20Aug 20Sep 20Oct 20Nov 20Dec 20JOPJan 21Feb 21Mar 21Apr 21May 21Jun 21Jul 21Aug 21Sep 21Oct 21Nov 21Dec 21TARGETAVG 20AVG 21AVG ALLAIM 0%KPI0
5R1Performance94%78%68%73%84%91%72%65%81%87%76%80%75%82%79%75%79%5%PerformanceR1
6Quality99.4%100.0%99.3%99.5%100.0%100.0%99.0%99.5%99.2%99.0%99.6%98.8%99.4%100.0%99.4%99.4%99.4%1%Quality
7Availability78%76%79%80%83%75%82%80%86%70%80%74%69%79%79%69%78%1%Availability
8OEE72%59%53%58%70%68%58%51%69%61%60%58%51%65%62%51%61%6%OEE
9R2Performance87%66%64%72%72%89%63%62%85%78%77%77%67%76%74%67%74%2%PerformanceR2
10Quality100.0%100.0%99.8%99.3%99.3%98.8%99.8%100.0%99.5%99.8%99.5%98.4%100.0%100%99.5%100.0%99.6%0%Quality
11Availability72%79%79%79%76%75%78%83%86%76%78%74%76%82%78%76%78%5%Availability
12OEE62%52%51%56%54%66%49%51%73%59%60%56%51%62%58%51%57%8%OEE
13R3Performance0%0%56%63%73%79%0%73%66%80%69%80%70%75%71%70%54%28%PerformanceR3
14Quality0.0%0.0%100.0%100.0%99.2%100.0%0.0%100.0%100.0%99.7%98.5%98.3%99.5%100%99.5%99.5%76.6%23%Quality
15Availability0%0%91%89%74%84%0%80%93%84%65%78%72%82%82%72%62%24%Availability
16OEE0%0%51%56%54%66%0%58%61%67%44%61%50%62%58%50%44%30%OEE
17C1(P) Performance85%83%0%0%97%88%82%76%86%86%87%80%85%78%87%85%78%71%18%PerformanceC1
18(Q) Quality100.0%100.0%0.0%0.0%100.0%100.0%100.0%100.0%100.0%100.0%100.0%100.0%100%100.0%100%100.0%100.0%84.6%15%Quality
19(A) Availability85%73%0%0%90%76%88%83%88%93%86%90%85%86%92%85%86%72%21%Availability
20OEE72%60%0%0%87%67%73%64%76%80%75%72%73%67%80%73%67%61%24%OEE
21C2(P) Performance91%79%76%95%88%87%78%76%85%83%86%80%84%0%89%84% 77%14%PerformanceC2
22(Q) Quality100.0%99.1%100.0%99.7%100.0%100.0%99.7%100.0%99.5%100.0%100.0%100.0%100%0.0%100%99.8% 92.2%8%Quality
23(A) Availability82%66%94%85%86%77%87%83%93%90%89%42%81%0%87%81% 75%14%Availability
24OEE75%51%72%81%76%67%67%63%79%75%76%34%68%0%78%68% 63%19%OEE
25S2(P) Performance100%94%88%93%97%97%91%93%95%95%96%87%94%97%100%94%97%94%6%PerformanceS2
26(Q) Quality99.7%98.7%100.0%99.5%100.0%99.6%99.5%99.1%99.4%99.6%98.7%100.0%99%99.6%100%99.5%99.6%99.5%1%Quality
27(A) Availability68%83%84%86%61%88%80%87%83%82%67%70%78%79%84%78%79%78%7%Availability
28OEE68%77%74%80%59%85%73%81%79%77%64%61%73%76%84%73%76%73%13%OEE
29S2(P) Performance100%90%94%96%97%100%87%94%96%93%97%93%95%97%100%95%97%95%5%PerformanceS2
30(Q) Quality100.0%99.1%98.6%100.0%99.5%99.0%99.5%100.0%99.0%97.5%98.1%100.0%99%100.0%100%99.2%100.0%99.2%1%Quality
31(A) Availability76%83%83%83%84%79%79%90%86%86%87%76%83%83%88%83%83%83%7%Availability
32OEE76%75%78%80%81%78%69%85%82%79%83%71%78%80%88%78%80%78%12%OEE
33
34Averages74%67%63%62%
OEE Data Entry
Cell Formulas
RangeFormula
AH4AH4=A4:AH8
AB5,AB7,AB9,AB11,AB13,AB15,AB17,AB19,AB21,AB23,AB25,AB27,AB29,AB31AB5=MIN(100%,AVERAGE(AC5:AD5)*(1+0.07))
AC5:AC32AC5=AVERAGEIF(C5:N5,"<>0")
AD5:AD32AD5=IFERROR(AVERAGEIF(P5:AA5,"<>0"),"")
AE5:AE32AE5=AVERAGE(C5:N5,P5:AA5)
AF5:AF32AF5=MAX(0%,+$AJ$2-AE5/AB5)
AB6,AB10,AB14,AB18,AB22,AB26,AB30AB6=MIN(100%,AVERAGE(AC6:AD6)*(1+0.01))
AB8,AB12,AB16,AB20,AB24,AB28,AB32,C32:N32,P32,P28,C28:N28,P24,C24:N24,P20,C20:N20,P16,C16:N16,P12,C12:N12,P8,C8:N8AB8=AB5*AB6*AB7
O17:O32O17=AVERAGEIF(C17:N17,"<>0")
AB34:AE34AB34=AVERAGE(AB32,AB28,AB24,AB20,AB16,AB12,AB8)
Cells with Conditional Formatting
CellConditionCell FormatStop If True
B29Cell Value=0textNO
B31Cell Value=0textNO
B30Cell Value=0textNO
B25Cell Value=0textNO
B27Cell Value=0textNO
B26Cell Value=0textNO
B21Cell Value=0textNO
B23Cell Value=0textNO
B22Cell Value=0textNO
B17Cell Value=0textNO
B19Cell Value=0textNO
B18Cell Value=0textNO
AF5:AF32Cell Value=0textNO
AF5:AF32Other TypeDataBarNO
O4Cell Value=0textNO
AE5:AE32Expression=AND((AE5-AB5)>=-0.05,(AE5-AB5)<0)textYES
AE5:AE32Expression=(AE5-AB5)<-0.05textYES
AE5:AE32Expression=(AE5-AB5)>=0textYES
AG29:AG31Cell Value=0textNO
AG32Cell Value=0textNO
AG25:AG27Cell Value=0textNO
AG28Cell Value=0textNO
AG21:AG23Cell Value=0textNO
AG24Cell Value=0textNO
AG17:AG19Cell Value=0textNO
AG20Cell Value=0textNO
AG13:AG15Cell Value=0textNO
AG16Cell Value=0textNO
AG9:AG11Cell Value=0textNO
AG12Cell Value=0textNO
AG4Cell Value=0textNO
AG5:AG7Cell Value=0textNO
AG8Cell Value=0textNO
B32Cell Value=0textNO
B28Cell Value=0textNO
B24Cell Value=0textNO
B20Cell Value=0textNO
B13:B15Cell Value=0textNO
B16Cell Value=0textNO
B9:B11Cell Value=0textNO
B12Cell Value=0textNO
B4Cell Value=0textNO
AE4Cell Value=0textNO
AD4Cell Value=0textNO
P4:AC4Cell Value=0textNO
C4:N4,B5:B7Cell Value=0textNO
AB4:AC4Cell Value=0textNO
B8Cell Value=0textNO
 
Upvote 0
i tried copying and transposing the data , then a standard chart for R3
But not really much good

What point are you trying to make , and is it only relevant to the last month , history irrelevant
 

Attachments

  • Screenshot 2021-02-20 at 14.58.19.png
    Screenshot 2021-02-20 at 14.58.19.png
    137.4 KB · Views: 7
Upvote 0
Hi Wayne, for your info, we have a project looking into OEE (Overall equipment effectiveness). The idea of the spreadsheet is to basically collate our historical data and use the data to then identify the areas that need to be worked on.

The biggest problem I have at the minute is averages. I cannot find the average (ignoring zeros or blanks). I can do it when covering one range but if I need to add a few ranges in the formula it will not have it, its driving me crazy....
 
Upvote 0
The biggest problem I have at the minute is averages. I cannot find the average (ignoring zeros or blanks). I can do it when covering one range but if I need to add a few ranges in the formula it will not have it,
Would you give some examples of the ranges that are giving an issue and what formulas you are using
 
Upvote 0

Forum statistics

Threads
1,214,787
Messages
6,121,569
Members
449,038
Latest member
Guest1337

We've detected that you are using an adblocker.

We have a great community of people providing Excel help here, but the hosting costs are enormous. You can help keep this site running by allowing ads on MrExcel.com.
Allow Ads at MrExcel

Which adblocker are you using?

Disable AdBlock

Follow these easy steps to disable AdBlock

1)Click on the icon in the browser’s toolbar.
2)Click on the icon in the browser’s toolbar.
2)Click on the "Pause on this site" option.
Go back

Disable AdBlock Plus

Follow these easy steps to disable AdBlock Plus

1)Click on the icon in the browser’s toolbar.
2)Click on the toggle to disable it for "mrexcel.com".
Go back

Disable uBlock Origin

Follow these easy steps to disable uBlock Origin

1)Click on the icon in the browser’s toolbar.
2)Click on the "Power" button.
3)Click on the "Refresh" button.
Go back

Disable uBlock

Follow these easy steps to disable uBlock

1)Click on the icon in the browser’s toolbar.
2)Click on the "Power" button.
3)Click on the "Refresh" button.
Go back
Back
Top