IRR Calculation Question

Susan50500

New Member
Joined
Dec 9, 2019
Messages
4
Office Version
  1. 2016
Platform
  1. Windows
Hello - I am having trouble with an IRR calculation. Try to figure out why my IRR suddenly "breaks" when my OpEx increases by $1. For example, when I increase my OpEx by $1 the model hits a certain threshold where IRR went from a strong ~50% to a negative %. I am not understanding why a minimal change in cash flow does this. Could it be the negative set of cash flows after year 6? See attached for a detailed comparison of cash flows.
 

Attachments

  • IRR Comparison.jpg
    IRR Comparison.jpg
    181.8 KB · Views: 22

Excel Facts

Repeat Last Command
Pressing F4 adds dollar signs when editing a formula. When not editing, F4 repeats last command.
It is unclear if and how we can help. But for starters, please use XL2BB to provide the numbers and IRR formulas that appear in your JPG. As someone else says, "A picture is worth 1000 words. An Excel file is worth 1000 pictures". (smile) Alternatively, if there is a reason why you cannot use XL2BB, upload an example Excel to a file-sharing website, and post the public download URL.

(Some people object to the latter. That is why XL2BB is preferred.)

My initial thoughts are....

I don't see how you can calculate an IRR for the difference (last lines), since the image shows only negative net cash flows.

Also, I am suspicious of an initial negative 4M cash flow in time 0 followed by a positive 5M cash flow in time 1, which is then followed by a more-reasonable progression of 5-digit and 6-digit cash flows.

It might help if you provided some context (explanation) of the cash flows, so that we can vet your notion of a "cash flow".

Finally, I don't understand what you mean by ``I increase my OpEx by $1``. Are you adding 1 to just time 0, changing -4,072,320 to -4,072,319 (!)? Or adding 1 to each cash flow in a row? Or what?

And I'm not sure I know what you mean by ``the model hits a certain threshold``. Is that just your interpretation of what might be the explanation? Or are you describing a process of adding 1 repetitively until things go south?
 
Upvote 0
Susan, please ignore my previous response. I completely misunderstood the problem description. This forum does not allow us to delete or at least edit such misdirected comments. :cry:

It would have helped if your description was more specific, and if your image included row and column labels for rerference. (I will assume the upper left corner is A1.)

For example, instead of simply writing "increase OpEx by $1", you might have added ``from 115/kW (A7) to 116/kW (A2). That results in the different cash flows in B8:V8 and B4:V4 respectively. I do not understand the huge difference in the IRRs, from 46.00% for 115/kW (B9) to -1.74% for 116/kW (B5)``. You might have also explained that ``the values in B12:V12 are the differences between the two cash flows; e.g. =B4-B8 in B12. And -47.75% in B13 is the difference between the IRRs; that is, =B5-B9``.

The importance of the last comment is: the value in B13 is a simple difference, not a "levered IRR", as you describe in A13. I thought the formula in B13 was =IRR(B12:V12). And that could not result in -47.75%, as I noted previously.

So you are not asking if a difference of "$1 in the model" could cause such a huge difference in the IRR.

Instead, you are asking if the concomitant differences in the cash flows -- an average of -3402 per year and a total of -68,031 -- could cause such a hugh difference in the IRR.

The short answer would be "obviously yes", if that were indeed the correct difference.

But it is not! When I manually enter the data :cautious: and calculate the IRRs, I do not see that difference at all. This is demonstrated below. (Note the scrollbar to the far right of the XL2BB snippet.)

irr neg pv and fv.xlsx
ABCD
1OpEx @ $115OpEx @ $116C-B
2IRR46.00%45.77%-0.23%
3YearCash FlowsCash Flows
40(4,072,320)(4,072,320)0
515,900,256 5,897,456 (2,800)
6253,996 51,140 (2,856)
7348,990 46,077 (2,913)
8443,909 40,937 (2,972)
9538,750 35,720 (3,030)
106(66,484)(69,575)(3,091)
117(71,800)(74,953)(3,153)
128(77,197)(80,413)(3,216)
139(82,676)(85,957)(3,281)
1410(88,239)(91,585)(3,346)
1511(93,888)(97,301)(3,413)
1612(99,623)(103,104)(3,481)
1713(105,446)(108,997)(3,551)
1814(111,360)(114,982)(3,622)
1915(117,365)(121,060)(3,695)
2016(123,463)(127,232)(3,769)
2117(129,656)(133,500)(3,844)
2218(135,946)(139,866)(3,920)
2319(142,334)(146,333)(3,999)
2420(148,821)(152,900)(4,079)
analysis
Rich (BB code):
Formulas:
B2: =IRR(B4:B24)
C2: =IRR(C4:C24)
D2: =C2-B2
D4: =C4-B4
Copy D4 into D5:D24

(Small differences like -2972 instead of -2971 in D8 are probably due to the fact the posted numbers are rounded.)

So the correct difference seems to be 46.00% for 115/kW v. 45.77% for 116/kW, a difference of only -0.23%.

Obviously, without seeing your IRR formulas, we cannot speculate on the mistake(s) that you might have made that resulted in an incorrect IRR for 116/kW.

(Well, I did try a few theories, to no avail.)

If you need further assistance, please post all formulas as well as data and the layout of the spreadsheet (i.e. row and column labels).

It is okay to copy the cash flows as constants (copy-and-paste-value) instead of the formulas and data that they might depend on.
 
Upvote 0
Errata....

I am not understanding why a minimal change in cash flow does this.
So you are not asking if a difference of "$1 in the model" could cause such a huge difference in the IRR. Instead, you are asking if the concomitant differences in the cash flows -- an average of -3402 per year and a total of -68,031 -- could cause such a hugh difference in the IRR. The short answer would be "obviously yes", if that were indeed the correct difference.

Actually, you are asking __how__ such a "minimal change" ($1 in one value in the model) could make such a difference.

And the short answer is: it is not such a "minimal change".

It is an average of -4.11% in 19 of 21 cash flows; an average of -3402 per year and a total of -68,031.

And as I noted, even that does not cause the huge difference in IRRs that you calculated somehow (TBD).
 
Upvote 0
Thank you so much for your help!!! Wow, now I am even more confused. I took the approach you did by stating cash flows vertically just to see if IRR would resemble what it did for you. I essentially pasted in what you did and also the whole number values that I have. I am getting different IRRs when using your values (rounded to nearest whole number) and my values which include decimals. Again, so strange that such small differences would throw off IRR so wildly???

Apologies for not posting the Excel originally, but I am having troubling figuring out how to do that.

OpEx @ $115OpEx @ $116DifferenceOpEx @ $115OpEx @ $116
IRR
46.00%​
45.77%​
-0.23%​
IRR
46.00%​
-1.74%​
YearCash FlowsCash FlowsYearCash FlowsCash Flows
0​
(4,072,320.00)(4,072,320.00)-(4,072,320.00)(4,072,320.00)
1​
5,900,256.005,897,456.00(2,800.00)5,900,256.305,897,456.30
2​
53,996.0051,140.00(2,856.00)53,995.7751,139.77
3​
48,990.0046,077.00(2,913.00)48,989.9346,076.81
4​
43,909.0040,937.00(2,972.00)43,908.5940,937.20
5​
38,750.0035,720.00(3,030.00)38,750.4235,719.61
6​
(66,484.00)(69,575.00)(3,091.00)(66,484.01)(69,575.44)
7​
(71,800.00)(74,953.00)(3,153.00)(71,799.92)(74,953.17)
8​
(77,197.00)(80,413.00)(3,216.00)(77,196.78)(80,413.10)
9​
(82,676.00)(85,957.00)(3,281.00)(82,676.02)(85,956.67)
10​
(88,239.00)(91,585.00)(3,346.00)(88,239.11)(91,585.37)
11​
(93,888.00)(97,301.00)(3,413.00)(93,887.52)(97,300.70)
12​
(99,623.00)(103,104.00)(3,481.00)(99,622.75)(103,104.20)
13​
(105,446.00)(108,997.00)(3,551.00)(105,446.36)(108,997.43)
14​
(111,360.00)(114,982.00)(3,622.00)(111,359.90)(114,982.00)
15​
(117,365.00)(121,060.00)(3,695.00)(117,364.96)(121,059.51)
16​
(123,463.00)(127,232.00)(3,769.00)(123,463.19)(127,231.62)
17​
(129,656.00)(133,500.00)(3,844.00)(129,656.22)(133,500.02)
18​
(135,946.00)(139,866.00)(3,920.00)(135,945.76)(139,866.43)
19​
(142,334.00)(146,333.00)(3,999.00)(142,333.51)(146,332.60)
20​
(148,821.00)(152,900.00)(4,079.00)(148,821.22)(152,900.30)
 
Upvote 0
OpEx @ $115OpEx @ $116
IRR
46.00%​
-1.74%​
YearCash FlowsCash Flows
-(4,072,320.000000000)(4,072,320.000000000)
1.005,900,256.3034917505,897,456.303491750
2.0053,995.76885160451,139.768851604
3.0048,989.92885160446,076.808851604
4.0043,908.58685160440,937.204451604
5.0038,750.41663160435,719.606583604
6.00(66,484.012714596)(69,575.438963556)
7.00(71,799.917254738)(74,953.172028678)
8.00(77,196.778702771)(80,413.098572189)
9.00(82,676.024913024)(85,956.671179830)
10.00(88,239.110384074)(91,585.369576216)
11.00(93,887.516772501)(97,300.701148487)
12.00(99,622.753416735)(103,104.201480240)
13.00(105,446.357871171)(108,997.434895946)
14.00(111,359.896450786)(114,981.995016057)
15.00(117,364.964786446)(121,059.505323022)
16.00(123,463.188391114)(127,231.619738422)
17.00(129,656.223237195)(133,500.023211449)
18.00(135,945.756345210)(139,866.432318949)
19.00(142,333.506384047)(146,332.595877261)
20.00(148,821.224283011)(152,900.295566089)
 
Upvote 0
I am getting different IRRs when using your values (rounded to nearest whole number) and my values which include decimals. Again, so strange that such small differences would throw off IRR so wildly???

I agree that it is strange. But now I can explain what is happening. See below. But first, some pointers for future reference, if I may....

Thank you so much for reposting the unrounded numbers with greater precision (9 decimal places). That was sufficient for me to reproduce the problem.

But in general, it would be better to choose a number of decimal places so that the smallest number is displayed with 15 signficant digits. In this case, that would be 10 decimal places, because the magnitude of the smallest number is an integer with 5 digits.

(Caveat TMI.... FYI, even 15 significant digits might not be sufficient for us to reproduce the exact internal binary values. And in rare cases, that can make a difference. So it would be ideal to add a parallel column with calculations of the form =A1-(A1&"") formatted as Scientific. That displays the infinitesimal difference between the internal binary value and decimal approximation up to 15 significant digits, which is all that Excel formats. But arguably, that might be too much trouble, and it is usually unnecessary. Just thought you might like to know.)

Re: ``Apologies for not posting the Excel originally, but I am having troubling figuring out how to do that``. That is understandable. But at the very least, you should copy-and-paste formulas from the Formula Bar, as I did. Caveat: When we do that, we lose the curly braces around array-entered formulas. :( So it would be prudent to either type the curly braces after pasting the formula into the posting, or at least indicating that a formula had been indeed array-entered.

Finally, again, it is useful to indicate the row and column labels of the cells. At the very least, indicate the cell label for the upper-left corner.

-----

Okay, let's explain your problem, if not solve it....

The root cause of the inconsistencies is: your cash flows have 2 IRRs(!).

That is not unusual for such "unrealistic"(?) cash flows. Recall that I was suspicious of the magnitude of the cash flow in year 1 relative to the other cash flows. And I am even more suspicious of the fact that the first and last cash flows have the same sign.

Later, I was able to "rationalize" it. But on second thought, I suspect that my rationalize does not fit the reality of your data.

Bottom line: Eventually, the "real solution" might be to have a discussion about the cash flow model itself. But let's put a pin in that for now, and focus on the mechanics of the IRR calculation.

So returning to the issue of 2 IRRs....

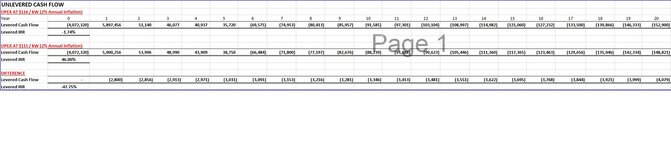
When the results of Excel IRR (or XIRR or RATE) surprise me, I generate a table of the "NPV curve"; that is, the NPV of the cash flows with various discount rates. For example:


Note: Click on cells or hover the cursor over them to see formulas. Also, note the XL2BB scrollbar on the far right.

Note that in all cases, there are sign changes between the same pairs of rates for both rounded and unrounded cash flows. Specifically, between -10% and zero; and between 40% and 50%.

So we might try "guesses" of -5% and 45%. The results are demonstrated below.

Book1
ABCDEF
1Unrounded Cash FlowsRounded Cash Flows
2OpEx@115OpEx@116OpEx@115OpEx@116
3IRR(B8:B28)-2.09%45.77%46.00%45.77%
4IRR(B8:B28,-5%)-2.09%-1.74%-2.09%-1.74%
5IRR(B8:B28,45%)46.00%45.77%46.00%45.77%
6
7Year
80-4,072,320.0000000000-4,072,320.0000000000-4072320-4072320
915,900,256.30349175005,897,456.303491750059002565897456
10253,995.768851604051,139.76885160405399651140
11348,989.928851604046,076.80885160404899046077
12443,908.586851604040,937.20445160404390940937
13538,750.416631604035,719.60658360403875035720
146-66,484.0127145960-69,575.4389635560-66484-69575
157-71,799.9172547380-74,953.1720286780-71800-74953
168-77,196.7787027710-80,413.0985721890-77197-80413
179-82,676.0249130240-85,956.6711798300-82676-85957
1810-88,239.1103840740-91,585.3695762160-88239-91585
1911-93,887.5167725010-97,300.7011484870-93888-97301
2012-99,622.7534167350-103,104.2014802400-99623-103104
2113-105,446.3578711710-108,997.4348959460-105446-108997
2214-111,359.8964507860-114,981.9950160570-111360-114982
2315-117,364.9647864460-121,059.5053230220-117365-121060
2416-123,463.1883911140-127,231.6197384220-123463-127232
2517-129,656.2232371950-133,500.0232114490-129656-133500
2618-135,945.7563452100-139,866.4323189490-135946-139866
2719-142,333.5063840470-146,332.5958772610-142334-146333
2820-148,821.2242830110-152,900.2955660890-148821-152900
Sheet1

Note that we get consistent results in rows 4 and 5 for both rounded and unrounded cash flows.

We get inconsistent results only with the default "guess" (10%) in row 3.

(Aside.... Interestingly, not only are the default results inconsistent between rounded and unrounded cash flows; but also, they are inconsistent between your version of Excel and mine(!). The latter inconsistencies really might be due to the fact that I am working with cash flows that are rounded to 14 significant digits in some cases, whereas you are working with the exact internal binary values.)

You might ask: why does the precision of the values cause Excel IRR to find different IRRs?

The simple answer is: we cannot know, since the internal Excel implementation is proprietary.

But in general, the mathematical methods for finding the IRR(s) are very fragile, regardless of the implmentation details, especially for cash flows like yours.

Does that explain things sufficiently?
 
Upvote 0

Forum statistics

Threads
1,214,936
Messages
6,122,340
Members
449,079
Latest member
rocketslinger

We've detected that you are using an adblocker.

We have a great community of people providing Excel help here, but the hosting costs are enormous. You can help keep this site running by allowing ads on MrExcel.com.
Allow Ads at MrExcel

Which adblocker are you using?

Disable AdBlock

Follow these easy steps to disable AdBlock

1)Click on the icon in the browser’s toolbar.
2)Click on the icon in the browser’s toolbar.
2)Click on the "Pause on this site" option.
Go back

Disable AdBlock Plus

Follow these easy steps to disable AdBlock Plus

1)Click on the icon in the browser’s toolbar.
2)Click on the toggle to disable it for "mrexcel.com".
Go back

Disable uBlock Origin

Follow these easy steps to disable uBlock Origin

1)Click on the icon in the browser’s toolbar.
2)Click on the "Power" button.
3)Click on the "Refresh" button.
Go back

Disable uBlock

Follow these easy steps to disable uBlock

1)Click on the icon in the browser’s toolbar.
2)Click on the "Power" button.
3)Click on the "Refresh" button.
Go back
Back
Top