Is it possible to fill the space between the 2 lines on a scatter graph?

hip2b2

Board Regular
Joined
May 5, 2003
Messages
135
Office Version
  1. 2019
Platform
  1. Windows
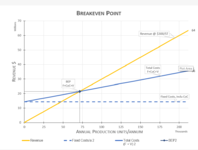
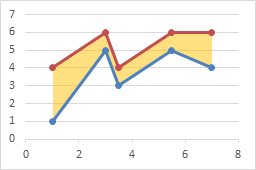
I would like to be able to add some kind of shading between the Yellow and Blue lines. Ideally, I would like to have the area greater than the BEP in one color (to indicate profit) and below the BEP in a different color to indicate loss).

I don't see any way to do this. Anyone have any ideas?

Thanks in advance.
 

Attachments

  • 2021-03-31_15h21_44.png
    2021-03-31_15h21_44.png
    49.9 KB · Views: 12

Excel Facts

Why does 9 mean SUM in SUBTOTAL?
It is because Sum is the 9th alphabetically in Average, Count, CountA, Max, Min, Product, StDev.S, StDev.P, Sum, VAR.S, VAR.P.
Thanks, missed this one.

I'll let the board know if it works in my case.
 
Upvote 0

Forum statistics

Threads
1,214,585
Messages
6,120,391
Members
448,957
Latest member
Hat4Life

We've detected that you are using an adblocker.

We have a great community of people providing Excel help here, but the hosting costs are enormous. You can help keep this site running by allowing ads on MrExcel.com.
Allow Ads at MrExcel

Which adblocker are you using?

Disable AdBlock

Follow these easy steps to disable AdBlock

1)Click on the icon in the browser’s toolbar.
2)Click on the icon in the browser’s toolbar.
2)Click on the "Pause on this site" option.
Go back

Disable AdBlock Plus

Follow these easy steps to disable AdBlock Plus

1)Click on the icon in the browser’s toolbar.
2)Click on the toggle to disable it for "mrexcel.com".
Go back

Disable uBlock Origin

Follow these easy steps to disable uBlock Origin

1)Click on the icon in the browser’s toolbar.
2)Click on the "Power" button.
3)Click on the "Refresh" button.
Go back

Disable uBlock

Follow these easy steps to disable uBlock

1)Click on the icon in the browser’s toolbar.
2)Click on the "Power" button.
3)Click on the "Refresh" button.
Go back
Back
Top