Hi. Totally new on the boards and just got into PowerPivot. My problem is that I'd like to create a measure that does something very much like SUMPRODUCT. The wrinkle is that one of the arrays to be factored into the SUMPRODUCT is pulled from a related table. Here are the particulars.
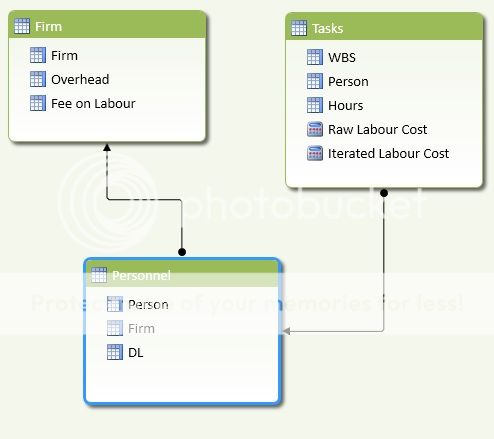
I have a table of personnel that includes their firms and their Direct Labor Rate (DL).
I have a table of firms that includes their Overhead (OH), Fee on Labor (FL) (note that both these variables vary by firm).
I have a table of Tasks where each line is a task item (WBS), a person from the personnel table, and an assigned number of hours (h).
So the relationships should be straight forward.
So the cost of any task for any specific person is (h)x(DL)x(1+OH)x(1+FL). Also, it will be useful to track each component of the cost calculation as a separate item. What I'd like to be able to do is PowerPivot the sums of costs or cost components (total costs, OH, FL, etc) sliced by tasks and/or firms.
 I realize I can use calculated columns to import the particular multipliers into the task table and just sum these calculated columns in the pivot, but it would be great to do this in a measure too.
So here are the two questions: If I had calculated columns in tasks that pulled in the individual person's rate, Firm OH, and Firm Fee, is there a sumproduct equavalent measure that I could do to multiply the columns together to get costs in the filtered context? Assuming that is possible, is there a way to do this without the calculated columns?
If it can't be done I can certainly live with calculated columns, but I'm thinking I might be able to gain performance by doing this in a measure. OTH, I'm wondering if the act of having a measure pull the data from related tables in order to 'synthesize' an array for the SUMPRODUCT is just as much system overhead as the calculated column in the first place anyway.
Thanks in advance for everyone's thoughts.
I have a table of personnel that includes their firms and their Direct Labor Rate (DL).
I have a table of firms that includes their Overhead (OH), Fee on Labor (FL) (note that both these variables vary by firm).
I have a table of Tasks where each line is a task item (WBS), a person from the personnel table, and an assigned number of hours (h).
So the relationships should be straight forward.
So the cost of any task for any specific person is (h)x(DL)x(1+OH)x(1+FL). Also, it will be useful to track each component of the cost calculation as a separate item. What I'd like to be able to do is PowerPivot the sums of costs or cost components (total costs, OH, FL, etc) sliced by tasks and/or firms.
I realize I can use calculated columns to import the particular multipliers into the task table and just sum these calculated columns in the pivot, but it would be great to do this in a measure too.So here are the two questions: If I had calculated columns in tasks that pulled in the individual person's rate, Firm OH, and Firm Fee, is there a sumproduct equavalent measure that I could do to multiply the columns together to get costs in the filtered context? Assuming that is possible, is there a way to do this without the calculated columns?
If it can't be done I can certainly live with calculated columns, but I'm thinking I might be able to gain performance by doing this in a measure. OTH, I'm wondering if the act of having a measure pull the data from related tables in order to 'synthesize' an array for the SUMPRODUCT is just as much system overhead as the calculated column in the first place anyway.
Thanks in advance for everyone's thoughts.