Issue with Graph in excel

Gautham A

Board Regular
Joined
May 25, 2020
Messages
107
Office Version
  1. 2016
Platform
  1. Windows
Hi Team,

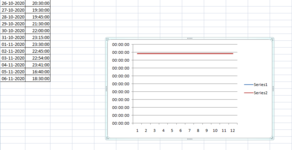
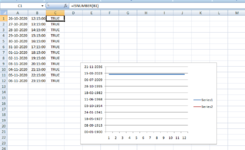
Using the following data, I'm trying to plot a line graph with time on y axis and date on x axis. All I'm getting is a single horizontal line. Not sure what to do. Can someone help me on this?

26-10-2020​
20:30:00​
27-10-2020​
19:30:00​
28-10-2020​
19:45:00​
29-10-2020​
21:30:00​
30-10-2020​
22:00:00​
31-10-2020​
23:15:00​
01-11-2020​
23:30:00​
02-11-2020​
22:45:00​
03-11-2020​
22:54:00​
04-11-2020​
23:41:00​
05-11-2020​
16:40:00​
06-11-2020​
18:30:00​
 

Attachments

  • graph.PNG
    graph.PNG
    19.7 KB · Views: 10

Excel Facts

What is the last column in Excel?
Excel columns run from A to Z, AA to AZ, AAA to XFD. The last column is XFD.
Hi

First thing that comes to mind is that those are not time values but strings.

Assuming cell B2 has one of the values that you posted that seem like time, try in another cell:

=ISNUMBER(B2)

You should get true if it's a time value.
 
Upvote 0
Hi
I'm getting TRUE when i applied that formula.
 

Attachments

  • graph 2.PNG
    graph 2.PNG
    29.3 KB · Views: 9
Upvote 0
Hi

I don't understand the chart you posted. Very strange numbers in the Y axis and all zeros in the X axis?

I just copied your values and tried a line chart and got:

cht02.jpg
 
Upvote 0
The OPs .png shows 2 series lines. Single series data?
 
Upvote 0
Hi
This is how I exactly want. But all I'm getting is a flat line. Not sure where it is getting wrong in my excel
The numbers in Y axis are the time at which a file came on different days.
 
Upvote 0
Hi daverunt,
Yes I'm getting 2 series lines. Ideally I should get only one
 
Upvote 0
When I select only column B(time values) I get the values correctly.
But I need the dates in X axis. When I try to include the date as well, then i get a single horizontal line
 
Upvote 0
After you insert the time values, to get the horizontal axis values:

Select the chart.

Ribbon->Chart Tools->Design->Select Data

Click on the Edit button below the Horizontal (Category) Axis Labels

In the box enter the range of the X axis values (or select it in the sheet)
 
Upvote 0
Solution

Forum statistics

Threads
1,214,786
Messages
6,121,546
Members
449,038
Latest member
Guest1337

We've detected that you are using an adblocker.

We have a great community of people providing Excel help here, but the hosting costs are enormous. You can help keep this site running by allowing ads on MrExcel.com.
Allow Ads at MrExcel

Which adblocker are you using?

Disable AdBlock

Follow these easy steps to disable AdBlock

1)Click on the icon in the browser’s toolbar.
2)Click on the icon in the browser’s toolbar.
2)Click on the "Pause on this site" option.
Go back

Disable AdBlock Plus

Follow these easy steps to disable AdBlock Plus

1)Click on the icon in the browser’s toolbar.
2)Click on the toggle to disable it for "mrexcel.com".
Go back

Disable uBlock Origin

Follow these easy steps to disable uBlock Origin

1)Click on the icon in the browser’s toolbar.
2)Click on the "Power" button.
3)Click on the "Refresh" button.
Go back

Disable uBlock

Follow these easy steps to disable uBlock

1)Click on the icon in the browser’s toolbar.
2)Click on the "Power" button.
3)Click on the "Refresh" button.
Go back
Back
Top