Join 2 tables or connect 2 tables

uwmarkyo

New Member
Joined
Aug 11, 2021
Messages
43
Office Version
  1. 365
Platform
  1. Windows
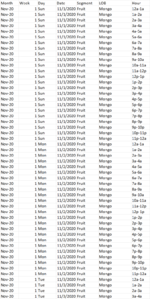
I have 2 tables
dataset

table A:
1639522307346.png


table B:
1639522424724.png


My goal is to merge or append table B's last 2 columns to table A.
Please be aware, these 2 tables are imported from other databases.
That's why I'm trying power query or power pivot to tidy this data.
I tried to merge them in power query, but it didn't work, and it generated a lot of duplicated numbers from table A.
Can someone give me a guidance of this one, thanks.
 

Attachments

  • 1639522344353.png
    1639522344353.png
    143.8 KB · Views: 3

Excel Facts

Move date out one month or year
Use =EDATE(A2,1) for one month later. Use EDATE(A2,12) for one year later.
We need a better understanding of what the 2 tables represent.
The way it looks both are summarised to be unique on the combination of Hour (code) and Date.
If this is correct did you try to do a join on both Hour and Date ?

If one of the tables is more likely to have all records in it so that you can make it the primary in a Left Outer Join.

Using the method above.
Make Table A the main table with a left outer join to Table B on Hour & Date
(Data type on both tables for the date field as "Date)
The result is below:

20211215 PQ Join sample2.xlsx
ABCDEFGHI
1MonthWeekDayDateSegmentLOBHourorder%
21/11/20201Sun1/11/2020FruitMongo12a-1a
31/11/20201Mon2/11/2020FruitMongo12a-1a2149%
41/11/20201Sun1/11/2020FruitMongo1a-2a
51/11/20201Sun1/11/2020FruitMongo2a-3a
61/11/20201Sun1/11/2020FruitMongo3a-4a
71/11/20201Sun1/11/2020FruitMongo4a-5a
81/11/20201Sun1/11/2020FruitMongo5a-6a
91/11/20201Sun1/11/2020FruitMongo6a-7a
101/11/20201Sun1/11/2020FruitMongo7a-8a
111/11/20201Sun1/11/2020FruitMongo8a-9a
121/11/20201Sun1/11/2020FruitMongo9a-10a
131/11/20201Sun1/11/2020FruitMongo10a-11a
141/11/20201Sun1/11/2020FruitMongo11a-12p
151/11/20201Sun1/11/2020FruitMongo12p-1p
161/11/20201Sun1/11/2020FruitMongo1p-2p
171/11/20201Sun1/11/2020FruitMongo2p-3p
181/11/20201Sun1/11/2020FruitMongo3p-4p
191/11/20201Sun1/11/2020FruitMongo4p-5p
201/11/20201Sun1/11/2020FruitMongo5p-6p
211/11/20201Sun1/11/2020FruitMongo6p-7p
221/11/20201Sun1/11/2020FruitMongo7p-8p
231/11/20201Sun1/11/2020FruitMongo8p-9p
241/11/20201Sun1/11/2020FruitMongo9p-10p
251/11/20201Sun1/11/2020FruitMongo10p-11p
261/11/20201Sun1/11/2020FruitMongo11p-12a
271/11/20201Mon2/11/2020FruitMongo1a-2a17%
281/11/20201Mon2/11/2020FruitMongo2a-3a956%
291/11/20201Mon2/11/2020FruitMongo3a-4a638%
301/11/20201Mon2/11/2020FruitMongo4a-5a13%
311/11/20201Mon2/11/2020FruitMongo5a-6a213%
321/11/20201Mon2/11/2020FruitMongo6a-7a2456%
331/11/20201Mon2/11/2020FruitMongo7a-8a267%
341/11/20201Mon2/11/2020FruitMongo8a-9a3100%
351/11/20201Mon2/11/2020FruitMongo9a-10a28%
361/11/20201Mon2/11/2020FruitMongo10a-11a1763%
371/11/20201Mon2/11/2020FruitMongo11a-12p1741%
381/11/20201Mon2/11/2020FruitMongo12p-1p6100%
391/11/20201Mon2/11/2020FruitMongo1p-2p00%
401/11/20201Mon2/11/2020FruitMongo2p-3p821%
411/11/20201Mon2/11/2020FruitMongo3p-4p2959%
421/11/20201Mon2/11/2020FruitMongo4p-5p514%
431/11/20201Mon2/11/2020FruitMongo5p-6p715%
441/11/20201Mon2/11/2020FruitMongo6p-7p3494%
451/11/20201Mon2/11/2020FruitMongo7p-8p2477%
461/11/20201Mon2/11/2020FruitMongo8p-9p2552%
471/11/20201Mon2/11/2020FruitMongo9p-10p120%
481/11/20201Mon2/11/2020FruitMongo10p-11p26100%
491/11/20201Mon2/11/2020FruitMongo11p-12a360%
501/11/20201Tue3/11/2020FruitMongo12a-1a
511/11/20201Tue3/11/2020FruitMongo1a-2a
521/11/20201Tue3/11/2020FruitMongo2a-3a
531/11/20201Tue3/11/2020FruitMongo3a-4a
Merge1
 
Upvote 0
We need a better understanding of what the 2 tables represent.
The way it looks both are summarised to be unique on the combination of Hour (code) and Date.
If this is correct did you try to do a join on both Hour and Date ?

If one of the tables is more likely to have all records in it so that you can make it the primary in a Left Outer Join.

Using the method above.
Make Table A the main table with a left outer join to Table B on Hour & Date
(Data type on both tables for the date field as "Date)
The result is below:
Hi Alex,

Thanks for the responding.
And sorry for not explaining it clear enough.

I think you're right. I discovered my table A didn't show my issue I presented.
I fixed my dataset as below:

Table A:
1639588143798.png


table B:
1639588184024.png


Both tables contains 2021 record, but I only list a small sample size to display my issue.

These 2 tables are from different workbooks(excel files)
I used power query or power pivot to import them, and then I use merge to join both tables
however, it caused the following issue:
1639588952800.png


It did join table B, but it also caused duplications on table A.
Can you teach me how to fix it?

Thanks,
 
Upvote 0
As I mentioned previously we need to understand what the to tables represent.
What is the description of the report you run for each table ? Is one a summary and one a transaction table or a summary at a different level ?

Both tables have date and hour (code) but TableA also has Folder.
What does folder mean and how does that tie back to TableB ?

Your last image in the previous post, is for a different period than the TableA & TableB images which make it impossible to see the how they relate.

I can't work with pictures.
You either need to give me an XL2BB for both TableA & TableB for at least one full day (the same day on both) or provide that in a spreadsheet via a share service (dropbox, google drive, onedrive etc). Using a share service make the file available to anyone with the link and post the link here. Obviously get rid of anything confidential.

Perhaps also mock up what output you are expecting eg if TableB is a summary and has figures in it and TableA needs to be grouped at a lower level then the figures on TableB will repeat on each group in TableB.

PS: what date format are you using dd/mm/yy or mm/dd/yy ?
 
Upvote 0

Forum statistics

Threads
1,214,606
Messages
6,120,492
Members
448,967
Latest member
visheshkotha

We've detected that you are using an adblocker.

We have a great community of people providing Excel help here, but the hosting costs are enormous. You can help keep this site running by allowing ads on MrExcel.com.
Allow Ads at MrExcel

Which adblocker are you using?

Disable AdBlock

Follow these easy steps to disable AdBlock

1)Click on the icon in the browser’s toolbar.
2)Click on the icon in the browser’s toolbar.
2)Click on the "Pause on this site" option.
Go back

Disable AdBlock Plus

Follow these easy steps to disable AdBlock Plus

1)Click on the icon in the browser’s toolbar.
2)Click on the toggle to disable it for "mrexcel.com".
Go back

Disable uBlock Origin

Follow these easy steps to disable uBlock Origin

1)Click on the icon in the browser’s toolbar.
2)Click on the "Power" button.
3)Click on the "Refresh" button.
Go back

Disable uBlock

Follow these easy steps to disable uBlock

1)Click on the icon in the browser’s toolbar.
2)Click on the "Power" button.
3)Click on the "Refresh" button.
Go back
Back
Top