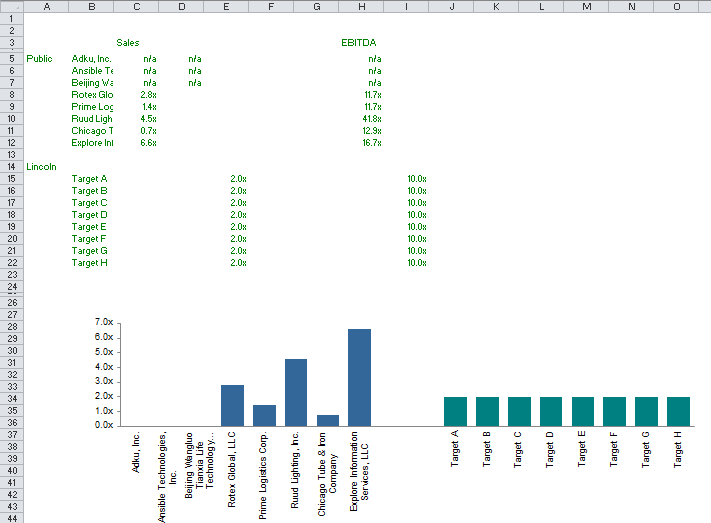
I have the data and the chart shown below and I'm wondering how I can display only certain data labels?
Basically, the first three companies are all n/a for sales (ignore the EBITDA columns) and so i want to label those as n/a. I tried creating a 2nd data set in column D and charting that, but it labeled all data points (D5:D12) as "0" instead of labeling datapoints D5:D7 as "n/a" and leaving the other data points without a label.
Appreciate any ideas / help you guys can offer.


