Line chart: is there a way to place first left grid line between first and second category labels?

fabiospark

New Member
Joined
May 29, 2015
Messages
13
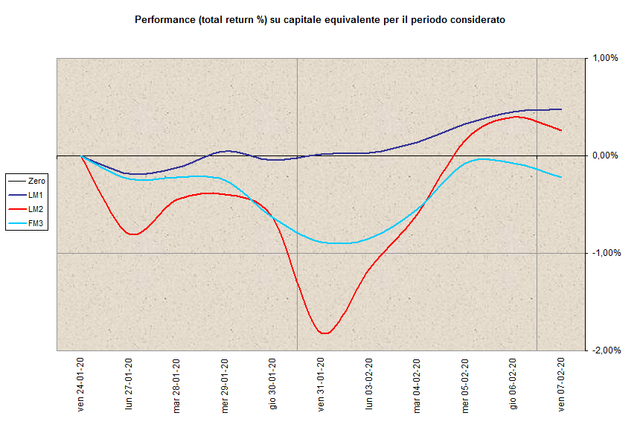
I'm building a portfolio performance line chart.
The length of the charted period (in working days) can be changed
through a combo box that dynamically changes the charted range.

All the periods in the list are a multiple of one week (5 working days) so the first day
on the left it will always be a friday. Each series plot will start in the same point
as all of their values are zeroes because I'm evaluating the performance of each series
against their friday values that so become a common floor.

To easily see where the weeks start (between friday and monday) I'm thinking to use
a grid with 5 points between each vertical lines but in this way, as far as I know, the first
left line of the grid will be on the left border of the plotting area, to the left of the first
category. Instead it would be very useful to be able to make the grid vertical lines start AFTER
the first category instead of BEFORE, as it normally is.

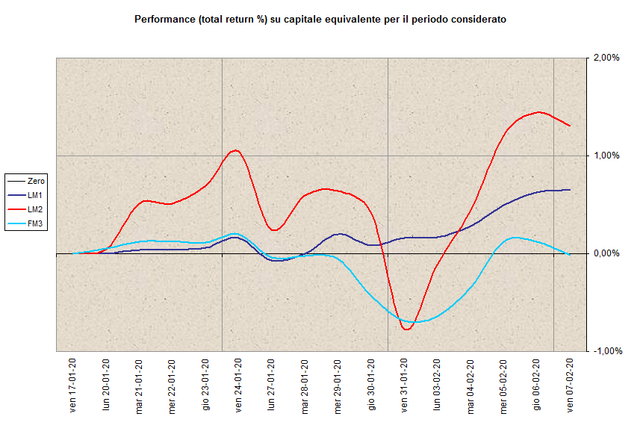
See the picture for a two weeks and a three weeks charts.


Thanks for listening.
 

Excel Facts

Workdays for a market open Mon, Wed, Friday?
Yes! Use "0101011" for the weekend argument in NETWORKDAYS.INTL or WORKDAY.INTL. The 7 digits start on Monday. 1 means it is a weekend.
All the periods in the list are a multiple of one week (5 working days) so the first day
on the left it will always be a friday.

That's weird. Why does a five weekday period start with a Friday?

Instead it would be very useful to be able to make the grid vertical lines start AFTER
the first category instead of BEFORE,

before? The grid lines are either ON the points or BETWEEN the points, depending on how the X axis is defined.

Can you post a data sample, a simple chart with the "before" and then describe what should be different in the "after"?[/QUOTE]
 
Upvote 0
That's weird. Why does a five weekday period start with a Friday?

The values in the data set are the portfolio (LM1, LM2, LM3, FM3) value recorded at the end of the day so
the friday values are the friday evening values, after the markets closing. As they will remain the same
until monday morning I see them as the starting point of the week and use them as the starting value
agaist which to evaluate the performance from than on. And as I want to see the common starting point
of each series (zero values) I need to include the first friday as the starting day of the period.


before? The grid lines are either ON the points or BETWEEN the points, depending on how the X axis is defined.

Can you post a data sample, a simple chart with the "before" and then describe what should be different in the "after"?

As you can see in the pictures I posted the vertical lines are BETWEEN two categorie,s and the leftmost one is right on top of the plotting area left border.

Thanks.
 
Upvote 0
You can't have chart grid lines in the positions you describe. You need to use helper series in an XY Scatter chart to simulate the grid lines. With that technique you can place them wherever you need.
 
Upvote 0

Forum statistics

Threads
1,214,846
Messages
6,121,905
Members
449,054
Latest member
luca142

We've detected that you are using an adblocker.

We have a great community of people providing Excel help here, but the hosting costs are enormous. You can help keep this site running by allowing ads on MrExcel.com.
Allow Ads at MrExcel

Which adblocker are you using?

Disable AdBlock

Follow these easy steps to disable AdBlock

1)Click on the icon in the browser’s toolbar.
2)Click on the icon in the browser’s toolbar.
2)Click on the "Pause on this site" option.
Go back

Disable AdBlock Plus

Follow these easy steps to disable AdBlock Plus

1)Click on the icon in the browser’s toolbar.
2)Click on the toggle to disable it for "mrexcel.com".
Go back

Disable uBlock Origin

Follow these easy steps to disable uBlock Origin

1)Click on the icon in the browser’s toolbar.
2)Click on the "Power" button.
3)Click on the "Refresh" button.
Go back

Disable uBlock

Follow these easy steps to disable uBlock

1)Click on the icon in the browser’s toolbar.
2)Click on the "Power" button.
3)Click on the "Refresh" button.
Go back
Back
Top