r1998
Board Regular
- Joined
- Sep 9, 2018
- Messages
- 106
Dear Friends and Respected Seniors,
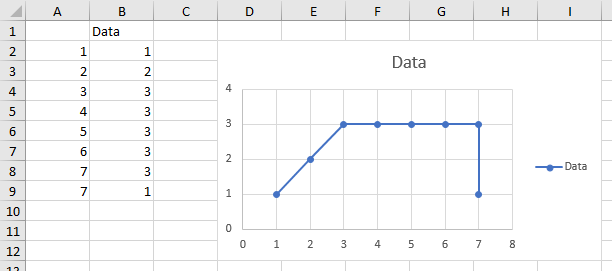
I have the Y coordinates for a simple line chart from A1 to A8, I select A1-A8 and create a line chart (X coordinates are generated automatically from 1-8)
Data in A1 to A8 is
<colgroup><col width="64" style="width:48pt"> </colgroup><tbody>
</tbody>The problem I am facing is, for the last two Y coordinates the X value is same, so it must make a vertical line in chart. I tried to assign X coordinates manually by filling values in B1-B8 as
<colgroup><col width="64" style="width:48pt"> </colgroup><tbody>
</tbody>
and then assigning by clicking on chart>selectdata>horizontal axis lables and selecting from b1-b8.... but it still didnt work
the chart that i have now is
https://paste.pics/4XCRB
the chart that i want
https://paste.pics/4XCRQ
Can anyone please kindly guide and help me
Awaiting your replies.
Thank you.
I have the Y coordinates for a simple line chart from A1 to A8, I select A1-A8 and create a line chart (X coordinates are generated automatically from 1-8)
Data in A1 to A8 is
| 1 |
| 2 |
| 3 |
| 3 |
| 3 |
| 3 |
| 3 |
| 1 |
<colgroup><col width="64" style="width:48pt"> </colgroup><tbody>
</tbody>
| 1 |
| 2 |
| 3 |
| 4 |
| 5 |
| 6 |
| 7 |
| 7 |
<colgroup><col width="64" style="width:48pt"> </colgroup><tbody>
</tbody>
and then assigning by clicking on chart>selectdata>horizontal axis lables and selecting from b1-b8.... but it still didnt work
the chart that i have now is
https://paste.pics/4XCRB
the chart that i want
https://paste.pics/4XCRQ
Can anyone please kindly guide and help me
Awaiting your replies.
Thank you.