Hi all,
So full disclosure, I'm a total Excel noob so I think my problem is a pretty easy fix for someone who knows their stuff.
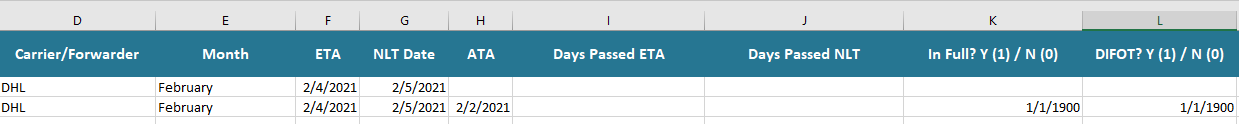
Essentially, I am making a key performance indicator (KPI) dashboard for a Shipping/Receiving department. The main thing we are tracking is delivered in full on time rates (DIFOT) over time.
I want to make a graph using "column E" the X-Axis and "column L" as the Y-Axis. Column L is essentially just stating whether the shipment was delivered in full on time, which is a simple binary yes or no answer. I think the easiest way to do it is simply to put a "1" in that cell for yes, and a "0" for no. However as you can see in the picture when I put a 1 in that cell it autopopulates to 1/1/1900.
Question1 : How do I stop this from auto-populating to 1/1/1900?
Question 2: How would I go about creating a graph that automatically updates each time someone new info into cells in column E and L, and reflects DIFOT as a percent on the Y with all 12 months on the X? Like I mentioned since DIFOT is a binary yes or no I think the easiest is to do Y=1 and N=0,but I want it to automatically update the graph and be reflected as a percent on the Y.
Appreciate the help in advance. Please let me know if you need any additional info to help with this solution.
Thanks!!!!!
So full disclosure, I'm a total Excel noob so I think my problem is a pretty easy fix for someone who knows their stuff.
Essentially, I am making a key performance indicator (KPI) dashboard for a Shipping/Receiving department. The main thing we are tracking is delivered in full on time rates (DIFOT) over time.
I want to make a graph using "column E" the X-Axis and "column L" as the Y-Axis. Column L is essentially just stating whether the shipment was delivered in full on time, which is a simple binary yes or no answer. I think the easiest way to do it is simply to put a "1" in that cell for yes, and a "0" for no. However as you can see in the picture when I put a 1 in that cell it autopopulates to 1/1/1900.
Question1 : How do I stop this from auto-populating to 1/1/1900?
Question 2: How would I go about creating a graph that automatically updates each time someone new info into cells in column E and L, and reflects DIFOT as a percent on the Y with all 12 months on the X? Like I mentioned since DIFOT is a binary yes or no I think the easiest is to do Y=1 and N=0,but I want it to automatically update the graph and be reflected as a percent on the Y.
Appreciate the help in advance. Please let me know if you need any additional info to help with this solution.
Thanks!!!!!