MACRO - Change Color of Bubble Chart Points Based on Values

mte498

New Member
Joined
Mar 23, 2019
Messages
5
Hello all,

I am trying to change the colors on an excel bubble chart based on specific values. I ran across the below video and it's ALMOST exactly what I need.

https://www.youtube.com/watch?v=nEOjcyGh1O0

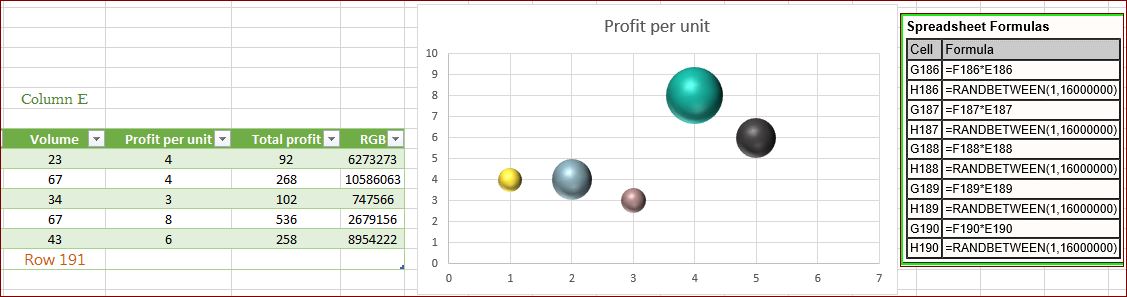
I unfortunately have way more color combos than just the Red, Green, Blue that are in the video. My solution has been to randomly assign each data point a number that corresponds to a single RGB color combo. For example, RGB combo (1,1,1) is assigned the number 1, RGB combo (1,2,1) is assigned the number 2, etc. On the chart's data, instead of Red, Green, Blue, I will use excel's Random function to randomly assign a number that is within the range of values on the RGB combos.

What's the best way to use these numbers as the chart's color driver vs. the Red, Green, Blue?

Please let me know if anything is unclear. Confusing, I know.

Thank you!
Mike
 

Excel Facts

How to find 2nd largest value in a column?
MAX finds the largest value. =LARGE(A:A,2) will find the second largest. =SMALL(A:A,3) will find the third smallest
Welcome to the Board

The RGB function returns a single number, see code below. You can generate random numbers within the valid range or hardcode the desired values.
In other words, you can input either the three RGB components or the final color number.
Are you going to do it in a random way?

Code:
Sub Sn()
MsgBox RGB(78, 23, 89)
End Sub<strike></strike>

<strike></strike>
 
Upvote 0
Thank you for the reply. I have a data table with the following data points:

1. SKU
2. Product Type
3. Profit per Unit
4. Volume
5. Total Profit
6. RGB Color Coding Value

I want to make two bubble charts, both of which will have Profit per Unit as the Y-axis, Volume as the X-axis, and Total Profit as the bubble size. The two charts will be (1) for individual SKUs and (2) for grouped Product Types.

For the individual SKU graph, the RGB Color Coding Value will be non-repeating and randomly selected. For the grouped Product Type graph, the RGB Color Coding Value will be randomly selected but repeating for like-Product Types.

Where I am getting stuck is how to write the Macro to get the RGB Color Coding Value to dictate the color of the bubble.

Thank you for the help!
 
Upvote 0
Does this help?

8ZtslSH.jpg


Code:
Sub BB()
Dim cht As Chart, ser As Series, r As Range, i%
ActiveSheet.ChartObjects("Chart 18").Activate       ' your chart name here
Set cht = ActiveChart
Set ser = cht.SeriesCollection(1)
Set r = [h186]                                      ' starting RGB cell
For i = 1 To ser.Points.Count
    ser.Points(i).Format.Fill.ForeColor.RGB = r
    Set r = r.Offset(1)
Next
End Sub
 
Upvote 0
It did not work as is. Do you have a back up data set or table that isn't shown in your posted screenshot that defines a specific RGB color combo for each random number between 1 and 16,000,000?

Thank you!
 
Upvote 0
Nevermind - it worked with the brackets. Thanks so much. Last question - any idea how to add centered data labels to each bubble?
 
Upvote 0
Do you need to automatically set the data label font colour? Black text on a dark background will not be visible.We could use a gradient sothat the bubble centre is always white.
Code:
Sub BB()Dim cht As Chart, ser As Series, r As Range, i%ActiveSheet.ChartObjects("Chart 18").Activate       ' your chart name hereSet cht = ActiveChartcht.SetElement 202                                  ' add data labelsSet ser = cht.SeriesCollection(1)Set r = [h186]                                      ' starting RGB cellFor i = 1 To ser.Points.Count    ser.Points(i).Format.Fill.ForeColor.RGB = r    Set r = r.Offset(1)NextEnd Sub
 
Upvote 0
The previous unformatted post was a courtesy of Internet Explorer…
Do you need to automatically set the data label font colour? Black text on a dark background will not be visible.
We could use a gradient so that the bubble centre is always white.

Code:
Sub BB()
Dim cht As Chart, ser As Series, r As Range, i%
ActiveSheet.ChartObjects("Chart 18").Activate       ' your chart name here
Set cht = ActiveChart
cht.SetElement 202                                  ' add data labels
Set ser = cht.SeriesCollection(1)
Set r = [h186]                                      ' starting RGB cell
For i = 1 To ser.Points.Count
    ser.Points(i).Format.Fill.ForeColor.RGB = r
    Set r = r.Offset(1)
Next
End Sub
 
Upvote 0
Yes - how could we use a gradient so that the bubble center is always white?

Also - the code you provided works in that it creates a data label, but the label has the text in your column F from the March 26 post - Profit per Unit. How can we make the data label show text from a totally new/separate column, say column I from the same screenshot?

Thank you!
 
Upvote 0
Apparently, VBA has limitations when it comes to fully formatting a chart. I am using a second series to show the data labels. The gradient solution is also shown.
There is an Insert Chart Field method to retrieve cell values and populate data labels, but it was not working for me.

xt427Ij.jpg


Code:
Sub BB()
Dim cht As Chart, ser As Series, r As Range, i%
ActiveSheet.ChartObjects("Chart 11").Activate       ' your chart name here
Set cht = ActiveChart
Set ser = cht.SeriesCollection(1)
Set r = [a67]                                      ' starting RGB cell
For i = 1 To ser.Points.Count
    ser.Points(i).Format.Fill.ForeColor.RGB = r
    Set r = r.Offset(, 1)
Next
Set ser = cht.SeriesCollection(2)                   ' holds the labels
ser.HasDataLabels = True
ser.DataLabels.Position = xlLabelPositionCenter
ser.Format.Fill.ForeColor.RGB = RGB(250, 250, 250)  ' white
Set r = [a66]                                       ' starting text cell
For i = 1 To ser.Points.Count
    ser.DataLabels(i).Format.TextFrame2.TextRange.Characters.Text = r
    Set r = r.Offset(, 1)
Next
End Sub
 
Upvote 0

Forum statistics

Threads
1,214,892
Messages
6,122,112
Members
449,066
Latest member
Andyg666

We've detected that you are using an adblocker.

We have a great community of people providing Excel help here, but the hosting costs are enormous. You can help keep this site running by allowing ads on MrExcel.com.
Allow Ads at MrExcel

Which adblocker are you using?

Disable AdBlock

Follow these easy steps to disable AdBlock

1)Click on the icon in the browser’s toolbar.
2)Click on the icon in the browser’s toolbar.
2)Click on the "Pause on this site" option.
Go back

Disable AdBlock Plus

Follow these easy steps to disable AdBlock Plus

1)Click on the icon in the browser’s toolbar.
2)Click on the toggle to disable it for "mrexcel.com".
Go back

Disable uBlock Origin

Follow these easy steps to disable uBlock Origin

1)Click on the icon in the browser’s toolbar.
2)Click on the "Power" button.
3)Click on the "Refresh" button.
Go back

Disable uBlock

Follow these easy steps to disable uBlock

1)Click on the icon in the browser’s toolbar.
2)Click on the "Power" button.
3)Click on the "Refresh" button.
Go back
Back
Top