Macro to move chart data series reference down one row for all charts and all series in workbook.

Taskmasterbob

New Member
Joined
Feb 5, 2021
Messages
1
Office Version
  1. 2016
Platform
  1. Windows
Hi guys

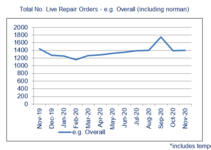
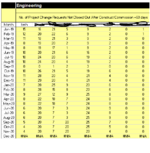
I have a number of line charts, some with one series some with multiple. There are around 70 of these charts which plot a variable over the past year from table on another worksheet. The table has months down the columns with a value for each location of the variable. See attached. Just a table.

Each month we add another row for the current month to these tables and we need to update the graph series to include this month. Basically moving the series references down one row in the spreadsheet. Ie from Jan to jan to feb to feb. this is done manually. This is so we can have a trend of the past 12 months of the variable at each location. Across the 70 or so graphs there are around 250 series to update. As you can imagine this is a bit of an task to update each series manually and move the reference down one row in the table.

For example series values =Data!$DN$79:$DN$91 would become =Data!$DN$80:$DN$92

Is there a macro which I can use to move the reference down one row and run through all charts and series on the charts?

Thanks for the help.

Also asked here Macro to move series reference down one row for all charts.
 

Attachments

  • capture example chart.PNG
    capture example chart.PNG
    14.7 KB · Views: 35
  • Capture- example.PNG
    Capture- example.PNG
    19.5 KB · Views: 37
Last edited by a moderator:

Excel Facts

How to total the visible cells?
From the first blank cell below a filtered data set, press Alt+=. Instead of SUM, you will get SUBTOTAL(9,)
Hi Taskmasterbob and Welcome to this forum. It's literally -48C outdoors so I seem to have some time on my hands to assist you. I wasn't able to Google anything relevant, and maybe there is a much simpler resolution, but I couldn't find it. So, this is what I came up with. The code assumes that these are embedded chart in a worksheet and that the relevant sheet is the active sheet. You can adjust the code to go forward or backwards however many months you desire. It is currently coded to adjust all of your series on all of your charts on the active sheet to go forward 1 month (interval). Please save a copy of your wb before trialling the sub. HTH. Dave
Sheet code....
Code:
Function UpdateSeries(ChartNum As Integer, ChtSrs As Integer, Interval As Integer)
'increases/decreases the range of a chart series(ChtSrs) of an ...
'  embededed chart(chartnum) by any Interval specified but maintains range size
'ie. UpdateSeries(1,1,1) increases the range of Chart(1), series(1) by 1 row
'ie. UpdateSeries(1,1,-1) decreases the range of Chart(1), series(1) by 1 row
Dim TempNum1 As Integer, TempNum2 As Integer, TempNum3 As Integer, TempNum4 As Integer
Dim SplitA As Variant, SplitB As Variant, SplitC As Variant
Dim TempA As String, TempB As String, TempC As String
Dim TempStr As String, TempStr2 As String
Dim Cht As Chart, ws As Worksheet
Set ws = ActiveSheet
Set Cht = ws.ChartObjects(ChartNum).Chart
SplitA = Split(Cht.SeriesCollection(ChtSrs).Formula, ":")
SplitB = Split(Cht.SeriesCollection(ChtSrs).Formula, ",")
SplitC = Split(Cht.SeriesCollection(ChtSrs).Formula, "$")
TempNum1 = CInt(Left(SplitC(2), Len(SplitC(2)) - 1)) + Interval
TempStr = Left(SplitA(0), Len(SplitA(0)) - Len(CStr(TempNum1))) & _
                                     TempNum1 & ":$" & SplitC(3) & "$"
TempNum2 = Right(SplitB(0) & "," & SplitB(1), Len(SplitB(0) & "," & _
    SplitB(1)) - Len(Left(SplitA(0), Len(SplitA(0)) - Len(CStr(TempNum1))) & _
                 TempNum1 & ":$" & SplitC(3) & "$")) + Interval
TempStr = TempStr & CStr(TempNum2) & ","

'2nd half
TempA = SplitA(0) & ":" & SplitA(1)
TempB = SplitB(0) & "," & SplitB(1) & ","
TempC = SplitC(0) & "$" & SplitC(1) & "$" & SplitC(2) & "$" & _
                     SplitC(3) & "$" & SplitC(4) & "$" & SplitC(5) & "$"
TempStr2 = Right(TempC, Len(TempC) - Len(TempB))
TempNum3 = CInt(Right(TempA, Len(TempA) - Len(TempC))) + Interval
TempStr2 = TempStr2 & TempNum3 & ":" & SplitC(7) & "$"
TempC = TempC & SplitC(6) & "$" & SplitC(7) & "$"
TempB = TempB & "," & SplitB(2)
TempNum4 = CInt(Right(TempB, Len(TempB) - Len(TempC))) + Interval
TempStr2 = TempStr2 & CStr(TempNum4)
TempStr2 = TempStr2 & Right(Cht.SeriesCollection(ChtSrs).Formula, _
                  Len(Cht.SeriesCollection(ChtSrs).Formula) - (Len(TempB) - 1))
Cht.SeriesCollection(ChtSrs).Formula = TempStr & TempStr2
ws.Range("A" & 1).Select
End Function

Sub test()
Dim sh As Worksheet, ChrtCnt As Integer
Dim chs As ChartObject, SeriesCnt As Integer
Set sh = ActiveSheet
For ChrtCnt = 1 To sh.ChartObjects.Count
For SeriesCnt = 1 To sh.ChartObjects(ChrtCnt).Chart.SeriesCollection.Count
Call UpdateSeries(ChrtCnt, SeriesCnt, 1)
Next SeriesCnt
Next ChrtCnt
End Sub
To operate run the "Test" sub
 
Upvote 0
Hi NdNoviceHlp,

I have the same question as Taskmasterbob, but I want to move multiple charts' data in rows by 1 column to the right (dynamic 12 month view). Can you advise what I'd need to change in the above script to modify to what I need please? Any help would be appreciated.

Thanks,
Simon
 
Upvote 0
Hi Simon and Welcome to the Board! So you have columns of data that represent months (Same amount of rows I assume) and U want to be able to chart any 12 consecutive months and be able to step forward 1 column to the right. The above approach won't help as it relies on rows having integer values that can have 1 added to their value which is then used to update the chart series formulas. Columns have a letter value which really makes it difficult to add a value to (not impossible) which is required to update the chart series formulas. As U can see by the code, it takes some messing around to adjust the chart formulas (and it's not -48C today). You may be better off trialling an alternate VBA approach. Dave
edit: I just looked at your pics and now I am confused. Your months are in rows and your series are in columns???
 
Upvote 0
OK Simon I think I may understand. U have only 1 chart and U want to only chart 1 column but be able to adjust the months which are rows. So start by adding all of your column series to the 1 chart. Then change the test code as follows:
Code:
Sub test(SeriesNum As Integer)
Dim sh As Worksheet, ChrtCnt As Integer
Dim chs As ChartObject, SeriesCnt As Integer
Set sh = ActiveSheet
'For ChrtCnt = 1 To sh.ChartObjects.Count
ChrtCnt = 1
For SeriesCnt = 1 To sh.ChartObjects(ChrtCnt).Chart.SeriesCollection.Count
If SeriesCnt = SeriesNum Then
Call UpdateSeries(ChrtCnt, SeriesCnt, 1)
'show series
With sh.ChartObjects(ChrtCnt).Chart.SeriesCollection(SeriesCnt)
.Format.Line.Visible = True
.MarkerStyle = xlMarkerStyleAutomatic
End With
Else
' Hide Series
With sh.ChartObjects(ChrtCnt).Chart.SeriesCollection(SeriesCnt)
.Format.Line.Visible = False
.MarkerStyle = xlMarkerStyleNone
End With
End If
Next SeriesCnt
'Next ChrtCnt
End Sub
To show column 1 (one month/row lower)...
Code:
Call Test(1)
To show column 2 (one month/row lower)...
Code:
Call Test(2)
etc...
HTH. Dave
 
Upvote 0
What a mess. The pics I was referring to on edit were actually from the original ingrate that never had the time to acknowledge the help. Also to call the test code, the first series is actually in column 2 but U would still use Call Test(1) etc. where (1) would indicate the series NOT the columns as posted. Anyways, sorry but I guess I'm back my original response and not really understanding your request. Dave
 
Upvote 0
This is a little more straightforward:

VBA Code:
Sub MoveSeriesDataDownOneRow()
  Dim chtob As ChartObject
  For Each chtob In ActiveSheet.ChartObjects
    Dim iSrs As Long, nSrs As Long
    With chtob.Chart
      nSrs = .SeriesCollection.Count
      Dim sFmla As Variant
      ReDim sFmla(1 To nSrs)
      For iSrs = 1 To nSrs
        sFmla(iSrs) = .SeriesCollection(iSrs).Formula
      Next
      For iSrs = 1 To nSrs
        Dim vFmla As Variant
        vFmla = Split(sFmla(iSrs), ",")
        Dim rXVals As Range, rYVals As Range
        Set rXVals = Range(vFmla(1))
        Set rYVals = Range(vFmla(2))
        With .SeriesCollection(iSrs)
          .XValues = rXVals.Offset(1)
          .Values = rYVals.Offset(1)
        End With
      Next
    End With
  Next
End Sub
 
Upvote 0
Well of course that's brilliant Jon. Much simpler but yet more complex. It must not be that cold where U are :) Dave
To move up one row...
Code:
With .SeriesCollection(iSrs)
.XValues = rXVals.Offset(-1)
.Values = rYVals.Offset(-1)
End With
 
Upvote 0
It occurred to me that Jon may have also resolved SimonKay's request which I'm guessing that I understand. If you want to keep the same number of rows and move the series data over 1 column, just adjust the code as follows. Dave
Code:
.XValues = rXVals.Offset(0)
.Values = rYVals.Offset(0, 1)
 
Upvote 0
I thought that my approach would solve a number of cases, but didn't say anything. Next time I won't keep my mouth shut.
 
Upvote 0

Forum statistics

Threads
1,214,975
Messages
6,122,538
Members
449,088
Latest member
RandomExceller01

We've detected that you are using an adblocker.

We have a great community of people providing Excel help here, but the hosting costs are enormous. You can help keep this site running by allowing ads on MrExcel.com.
Allow Ads at MrExcel

Which adblocker are you using?

Disable AdBlock

Follow these easy steps to disable AdBlock

1)Click on the icon in the browser’s toolbar.
2)Click on the icon in the browser’s toolbar.
2)Click on the "Pause on this site" option.
Go back

Disable AdBlock Plus

Follow these easy steps to disable AdBlock Plus

1)Click on the icon in the browser’s toolbar.
2)Click on the toggle to disable it for "mrexcel.com".
Go back

Disable uBlock Origin

Follow these easy steps to disable uBlock Origin

1)Click on the icon in the browser’s toolbar.
2)Click on the "Power" button.
3)Click on the "Refresh" button.
Go back

Disable uBlock

Follow these easy steps to disable uBlock

1)Click on the icon in the browser’s toolbar.
2)Click on the "Power" button.
3)Click on the "Refresh" button.
Go back
Back
Top