Market Basket Analysis Approach in Excel

denzo36

Board Regular
Joined
Sep 22, 2019
Messages
218
Office Version
  1. 365
Platform
  1. Windows
Hi guys, some help on the approach to this problem would be appreciated. It's a market basket analysis type problem but a more simplistic approach to the real thing.

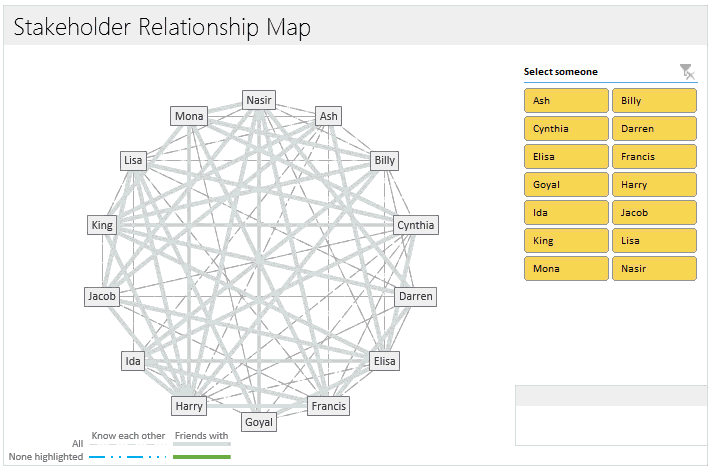
I have a list of policy numbers and associated Referral Codes. Each policy number can have one or more different referral codes (up to a max of 14) and there are over 100 different referral codes. (What the referral codes actually mean isn't really relevant). Each referral code is represented as one row on the data so if a policy number has more than one referral code, I'll have the policy number repeated in column A and the list of referral codes in column B. See the image which might explain it better.


Capture.PNG


What I need to analyse is the relationship between the different referral codes. So if for example code 1241 appears on a policy , how many times do the other codes appear with that codes or in conjunction with that code and other codes and in that way try and establish a likelihood that if a code does appear that another code is likely to appear. Likewise for the all the other codes, I need to try and be able to pick a referral code and be able to see what other codes appear with that code.

I can solve this problem with array formulas in Excel but I need to try and bring the solution into Tableau and automate the analysis in some way.

Is there any combination of logic formulas that you guys can think of to make this work?
 

Excel Facts

Get help while writing formula
Click the italics "fx" icon to the left of the formula bar to open the Functions Arguments dialog. Help is displayed for each argument.
Some kind of a node and edge presentation where each code is a node and the thickness/color/path-use-count-number for the paths connecting them reflects the likelihood of appearing together.

So selecting a node (code) wil show it in the center of the screen with up to 14 node linked to it/ I would think that physical distance would be the clearest indicator so if all 14 orbiting nodes were equidistant then they would all have the same chance of appearing, but if the center of one was closer than another it would have a higher chance of appearing. The size of each node could reflect the number of times the referral codeappears in the group of policies being analyzed.

Regarding:
I can solve this problem with array formulas in Excel
will you post them for us

For some alternate views see how Graphviz - Graph Visualization Software displays the info.
 
Upvote 0
Thanks for the recommendation, that looks like a good approach, my problem is the different number of referrals codes and the many multiple combinations that can occur, the volume makes any approach hard to visualise.

Regarding the array formulas, what I did was first find the top 10 most occuring codes across all policies, then individually for each of those top 10 codes, find which codes appear most frequently with each of those. There are also questions like if code xxxx appears, what is the code most likely to appear with that code and when there is no more than 2 codes on the policy etc.

My approach is quite brute force to be honest but the approach was to list all policy number and associated referral codes in say columns A-O (snippet of policies shown here)

1586811720572.png


Then in columns P onwards list all possible referral codes and use an array formula that said if the referral code in the all possible list appear in any of the columns 2-14 (column 1 had the policy number) then 1, else 0.

1586811846108.png


I know there are algorithms for this stuff but my VBA skills would not be at that level yet
 
Upvote 0
This looked like a starting point for an excel-only design

And some interesting Tableau layouts
 
Upvote 0
Perfect, thanks for the recommendations.

I did a bit of research last night and Microsoft did have a Table AnalysisTools add-in for Excel that included a shopping basket analysis option but that add-in is not supported in Excel 2016 onward.
 
Upvote 0
Great, I'll have a look at this, many thanks again for the recommendations
 
Upvote 0

Forum statistics

Threads
1,214,833
Messages
6,121,857
Members
449,051
Latest member
excelquestion515

We've detected that you are using an adblocker.

We have a great community of people providing Excel help here, but the hosting costs are enormous. You can help keep this site running by allowing ads on MrExcel.com.
Allow Ads at MrExcel

Which adblocker are you using?

Disable AdBlock

Follow these easy steps to disable AdBlock

1)Click on the icon in the browser’s toolbar.
2)Click on the icon in the browser’s toolbar.
2)Click on the "Pause on this site" option.
Go back

Disable AdBlock Plus

Follow these easy steps to disable AdBlock Plus

1)Click on the icon in the browser’s toolbar.
2)Click on the toggle to disable it for "mrexcel.com".
Go back

Disable uBlock Origin

Follow these easy steps to disable uBlock Origin

1)Click on the icon in the browser’s toolbar.
2)Click on the "Power" button.
3)Click on the "Refresh" button.
Go back

Disable uBlock

Follow these easy steps to disable uBlock

1)Click on the icon in the browser’s toolbar.
2)Click on the "Power" button.
3)Click on the "Refresh" button.
Go back
Back
Top