hello all, I am trying to fit a cooling graph with a trendline and I have found the power line to fit the best, as well as corresponding with Newton's law of cooling. However, I am not savvy enough to discuss how similar or dissimilar the two equations are! 
the resulting equations from two different curves are as follows:
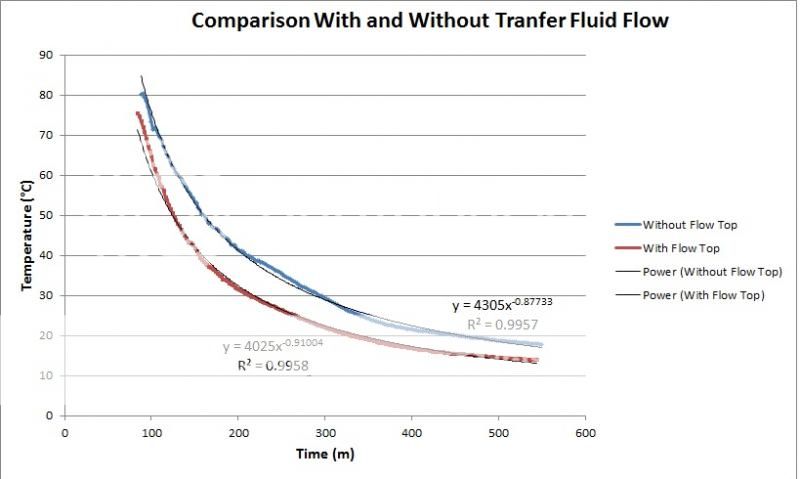
y=4305 x^-0.87733
y=4025 x^-0.91004
both fits have an R^2 of 0.996.
I am analyzing two scenarios of cooling the same object with three variables, one intended (the extraction of energy using water flow in one case, and no extraction in the other) and the others not under my control: different starting temperatures and different ambient temperatures. I need to understand if these are generally the same curve, or how very different are they? is there any statistical way to represent their relationship?
Thanks in advance for any help deciphering this!!!
the resulting equations from two different curves are as follows:
y=4305 x^-0.87733
y=4025 x^-0.91004
both fits have an R^2 of 0.996.
I am analyzing two scenarios of cooling the same object with three variables, one intended (the extraction of energy using water flow in one case, and no extraction in the other) and the others not under my control: different starting temperatures and different ambient temperatures. I need to understand if these are generally the same curve, or how very different are they? is there any statistical way to represent their relationship?

Thanks in advance for any help deciphering this!!!


