johnrobgray
New Member
- Joined
- Aug 21, 2017
- Messages
- 43
- Office Version
- 2013
- Platform
- Windows
Hi
I was wondering if anyone can help me?
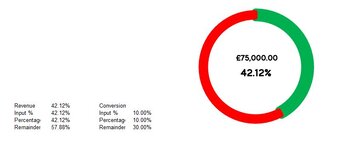
I'm creating a Progressive Donut Chart but stuck on an issue. It is counting % to a target and when it hits 100% it goes green.
However, if they go over target, say 115% it then shows some red as the formula in the % goes to a minus
I am using this formula and can't figure out what the Max Formula needs to be.
=1-C55
I want it to work in the same way, but when they go over target, to display fully green.
I was wondering if anyone can help me?
I'm creating a Progressive Donut Chart but stuck on an issue. It is counting % to a target and when it hits 100% it goes green.
However, if they go over target, say 115% it then shows some red as the formula in the % goes to a minus
I am using this formula and can't figure out what the Max Formula needs to be.
=1-C55
I want it to work in the same way, but when they go over target, to display fully green.