Merging data with a similar value in Excel

esasad

New Member
Joined
Jan 15, 2021
Messages
3
Office Version
  1. 2016
Platform
  1. Windows
Hello everyone,

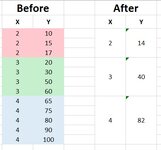
I have sets of data points (X and Y shown in blocks with a similar color), each of the data sets with a unique X value. I would like to merge the similar (X) values and only have one value instead in each colored block as the X value. In each data set (colored blocks), I would like to have an average of the Y values in a separate box.

I just manually did the calculations for some blocks, but due to a high number of data sets, I am just wondering if you could kindly propose to me a formula/code that I can use. Any hint would be also highly appreciated.

I would appreciate your help in advance:

Cheers
 

Attachments

  • Untitled.jpg
    Untitled.jpg
    30.9 KB · Views: 5

Excel Facts

Move date out one month or year
Use =EDATE(A2,1) for one month later. Use EDATE(A2,12) for one year later.
xyxy
210214
215340
217482
320
330
350
360
465
475
480
490
4100

Power Query:
let
    Source = Excel.CurrentWorkbook(){[Name="Table1"]}[Content],
    Group = Table.Group(Source, {"x"}, {{"y", each List.Average([y]), type number}})
in
    Group
or
xAverage of y
214
340
482
 
Upvote 0
Dear Sandy666,
Thank you so much for your work, it is exactly what I have been looking for recently. I have tried to spend some time to understand how I should implement it in Excel through watching some YouTube instructions, but I would like to ask you kindly let me know the procedure in Excel to run this code.

Cheers,
 
Upvote 0
make your range as Excel Table (Ctrl+T)
select any cell in this table
from the ribbon Data tab choose From Table
it will open Power Query Editor where:
- select column X
from PQE ribbon Home tab choose Group By
setup for this you've here
grpby.png

then OK
Home tab - Close&Load
----
for Pivot Table
select your range
from the ribbon - Insert - Pivot table
X into the ROWS
Y into the VALUES then select from Value Field Setting - Average
 
Upvote 0
Solution
Hi Sandy666,
I would like to thank you so much as your suggestions worked very well. With your help, I have managed to plot all my graphs in a nice way.
Cheers
 
Upvote 0

Forum statistics

Threads
1,214,641
Messages
6,120,685
Members
448,978
Latest member
rrauni

We've detected that you are using an adblocker.

We have a great community of people providing Excel help here, but the hosting costs are enormous. You can help keep this site running by allowing ads on MrExcel.com.
Allow Ads at MrExcel

Which adblocker are you using?

Disable AdBlock

Follow these easy steps to disable AdBlock

1)Click on the icon in the browser’s toolbar.
2)Click on the icon in the browser’s toolbar.
2)Click on the "Pause on this site" option.
Go back

Disable AdBlock Plus

Follow these easy steps to disable AdBlock Plus

1)Click on the icon in the browser’s toolbar.
2)Click on the toggle to disable it for "mrexcel.com".
Go back

Disable uBlock Origin

Follow these easy steps to disable uBlock Origin

1)Click on the icon in the browser’s toolbar.
2)Click on the "Power" button.
3)Click on the "Refresh" button.
Go back

Disable uBlock

Follow these easy steps to disable uBlock

1)Click on the icon in the browser’s toolbar.
2)Click on the "Power" button.
3)Click on the "Refresh" button.
Go back
Back
Top