Multi-level x-axis on scatter plot

arehman1289

New Member
Joined
Dec 10, 2020
Messages
22
Office Version
  1. 365
Platform
  1. Windows
Hello Everyone

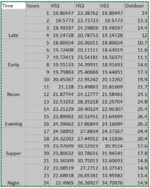
I have 6 columns of data that i need to plot using a scatter plot.My data looks somewhat like the attached picture.

On the x-axis id like to have two axis of time and hours. And on the y-axis column 3-6. Ive been able to plot it easily in a histogram but cant seem to do a multi x-axis on a scatter plot. Ive googled almost everything but cant seem to find a lead.

Please help.

Thanks
 

Attachments

  • Capture.PNG
    Capture.PNG
    35.1 KB · Views: 35

Excel Facts

Shade all formula cells
To shade all formula cells: Home, Find & Select, Formulas to select all formulas. Then apply a light fill color.

Forum statistics

Threads
1,214,839
Messages
6,121,887
Members
449,057
Latest member
Moo4247

We've detected that you are using an adblocker.

We have a great community of people providing Excel help here, but the hosting costs are enormous. You can help keep this site running by allowing ads on MrExcel.com.
Allow Ads at MrExcel

Which adblocker are you using?

Disable AdBlock

Follow these easy steps to disable AdBlock

1)Click on the icon in the browser’s toolbar.
2)Click on the icon in the browser’s toolbar.
2)Click on the "Pause on this site" option.
Go back

Disable AdBlock Plus

Follow these easy steps to disable AdBlock Plus

1)Click on the icon in the browser’s toolbar.
2)Click on the toggle to disable it for "mrexcel.com".
Go back

Disable uBlock Origin

Follow these easy steps to disable uBlock Origin

1)Click on the icon in the browser’s toolbar.
2)Click on the "Power" button.
3)Click on the "Refresh" button.
Go back

Disable uBlock

Follow these easy steps to disable uBlock

1)Click on the icon in the browser’s toolbar.
2)Click on the "Power" button.
3)Click on the "Refresh" button.
Go back
Back
Top