non-conventional pie graph

hotdogs1999

Board Regular
Joined
Dec 11, 2018
Messages
57
Hello,

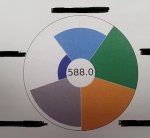
I am looking to somehow create the attached pie graph in Excel (i understand that this one was created on Excel as well).

There are 5 different factors it is measuring, and each segment has a total of (for examples sake) 111 points that it would earn - bear in mind there is multiple sub-factors behind each segment that influence the final 'score' that the segment gets - but is have all these sorted.

what i am unsure on how to do, is how to make the segment 'shorter' when the score that it gets doesn't equal the full 111 that it could get.
e.g. from the attached, the blue segment would likely have a score of about 70, as its only about 2/3rds of the way to the outer circle. and the green and orange ones obviously have the full 111 points so that are right out to the edge.

i can pull all my back end calculations into 1-2 figures for each segment, e.g. the total points received, and the difference between that and the total 111, so the actual data for feeding the graph will be simplistic.

Thanks in advance
 

Attachments

  • graph.jpg
    graph.jpg
    63.1 KB · Views: 15

Excel Facts

When did Power Query debut in Excel?
Although it was an add-in in Excel 2010 & Excel 2013, Power Query became a part of Excel in 2016, in Data, Get & Transform Data.
Hi

One option, if you know vba, is to use a doughnut chart.

You'd add 111 series with the same values and for each series you'd just have to make each slice visible or invisible.
For ex. :
- in the outer series of your picture you'd make 2 slices visible and the other 3 invisible.
- in the innermost series all the slices would be visible.

I said you'd have to know vba because it would be extremely tedious to do it manually.

HTH
 
Upvote 0
thanks,

i thought that VBA might be the viable option.

only issue is i have no idea where to start when it comes to that sort of thing...

would appreciate if someone could share some code that would get me started, if it isn't too tedious.

Thanks
 
Upvote 0
Hi

I don't have much time to work on this, but I did some code that can be used to get started on this type of chart.

The chart has 2 inputs:
- the usual pie chart values, that define the angles each slice spans
- the values needed for this particular type of chart, that define for each slice its radius as a percentage of the total pie radius

The chart has a hole in the middle, like in your picture.

Try it on an empty workbook.

Play with the array values to see how it reacts.
You can change the number of values in the arrays, as long as both have the same number of values.

The values in the second array define percentages, so only values up to 100.
Notice that, in the code posted, the hole in the middle has a radius of 10% of the total radius of the pie chart. This means that if you specify in the second array a value less than 10 you won't see that slice as is was swallowed by the hole.

Modify the code as per your specific needs.

Hope this helps.


VBA Code:
' PGC 202009
' uses a doughnut chart to simulate a pie chart with slices with different radii
Sub PieSlicesDifferentRadii()
Dim vSliceAng As Variant, vSliceRad As Variant ' arrays that define the angles and radii of the slices
Dim chtobj As ChartObject
Dim j As Long, k As Long

vSliceAng = VBA.Array(30, 20, 20, 15, 20) ' standard pie chart values, define the angle each slice spans
vSliceRad = VBA.Array(100, 100, 90, 70, 20) ' define the radial percentage size of each slice

' add a chart
With Range("B2:M30")
    Set chtobj = ActiveSheet.ChartObjects.Add(.Left, .Top, .Width, .Height)
End With

With chtobj.Chart
    .ChartType = xlDoughnut
    
    ' adds the series
    For j = 1 To 90 ' only 90 series, the hole in the middle swallowed 10
        With .SeriesCollection.NewSeries
            .Values = vSliceAng
        End With
    Next j
    .ChartGroups(1).DoughnutHoleSize = 10 ' small hole

    ' makes each slice of each series visible or invisible
    For j = 0 To UBound(vSliceAng)
        For k = 1 To 90
            With .SeriesCollection(k).Points(j + 1)
                If k <= vSliceRad(j) - 10 Then  ' minus 10 because of the hole in the middle
                    .Format.Line.ForeColor.RGB = .Format.Fill.ForeColor.RGB
                Else
                    .Format.Fill.Visible = msoFalse
                    .Format.Line.Visible = msoFalse
                End If
            End With
        Next k
Next j

End With
End Sub
 
Upvote 0
' adds the series For j = 1 To 90 ' only 90 series, the hole in the middle swallowed 10 With .SeriesCollection.NewSeries .Values = vSliceAng End With Next j .ChartGroups(1).DoughnutHoleSize = 10 ' small hole ' makes each slice of each series visible or invisible For j = 0 To UBound(vSliceAng) For k = 1 To 90 With .SeriesCollection(k).Points(j + 1) If k <= vSliceRad(j) - 10 Then ' minus 10 because of the hole in the middle .Format.Line.ForeColor.RGB = .Format.Fill.ForeColor.RGB Else .Format.Fill.Visible = msoFalse .Format.Line.Visible = msoFalse

do i need to copy this and do it for each slice?
 
Upvote 0
To try the code just copy the code to a new workbook and execute it.
The chart appears in the active sheet.
 
Upvote 0

Forum statistics

Threads
1,214,551
Messages
6,120,156
Members
448,948
Latest member
spamiki

We've detected that you are using an adblocker.

We have a great community of people providing Excel help here, but the hosting costs are enormous. You can help keep this site running by allowing ads on MrExcel.com.
Allow Ads at MrExcel

Which adblocker are you using?

Disable AdBlock

Follow these easy steps to disable AdBlock

1)Click on the icon in the browser’s toolbar.
2)Click on the icon in the browser’s toolbar.
2)Click on the "Pause on this site" option.
Go back

Disable AdBlock Plus

Follow these easy steps to disable AdBlock Plus

1)Click on the icon in the browser’s toolbar.
2)Click on the toggle to disable it for "mrexcel.com".
Go back

Disable uBlock Origin

Follow these easy steps to disable uBlock Origin

1)Click on the icon in the browser’s toolbar.
2)Click on the "Power" button.
3)Click on the "Refresh" button.
Go back

Disable uBlock

Follow these easy steps to disable uBlock

1)Click on the icon in the browser’s toolbar.
2)Click on the "Power" button.
3)Click on the "Refresh" button.
Go back
Back
Top