Offset Function/Dynamic Charts - dates not aligning

Dynawoman

New Member
Joined
Mar 28, 2023
Messages
4
Office Version
  1. 365
Platform
  1. Windows
Hi - I am looking for some help with the offset function and dynamic charts. I have created my defined names and created the chart; however, the dates are not aligning properly. I cannot find any information on what data types can be used in these defined names. Some of the data are formulas. Is this causing the problem?

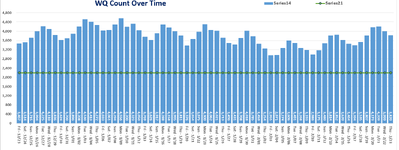
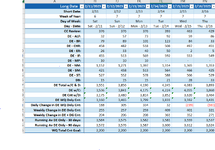
Scenario: each day the chart is updated with new data and we have to remove a day and add a day. I don't want to have to manually do this, I want it done automatically. I want the chart to always display the last 60 days. I'm using =OFFSET($A$5,0,COUNTA($B$5:$RU$5),1,-60). I originally had it using the entire row 5, but changed it to B-RU to see if that would help and no such luck. There is a formula in the Day-Date cell: =B4&" - " & TEXT(B2,"m/dd"). I also changed this to be a custom date and the data still does not align. Is there a different function I should be using? Any help is appreciated. TYIA!
 

Attachments

  • chart.PNG
    chart.PNG
    98.2 KB · Views: 4
  • data.PNG
    data.PNG
    59.7 KB · Views: 4

Excel Facts

Can you sort left to right?
To sort left-to-right, use the Sort dialog box. Click Options. Choose "Sort left to right"
Test Dynamic Charts2.xlsx
ABCDEFGHIJKLM
1Long Date 12/1/202212/2/202212/3/202212/4/202212/5/202212/6/202212/7/202212/8/202212/9/202212/10/202212/11/202212/12/2022
2Short Date:12/0112/0212/0312/0412/0512/0612/0712/0812/0912/1012/1112/12
3Week of Year:494949505050505050505151
4Day of Week:ThuFriSatSunMonTueWedThuFriSatSunMon
5Day - Date:Thu - 12/01Fri - 12/02Sat - 12/03Sun - 12/04Mon - 12/05Tue - 12/06Wed - 12/07Thu - 12/08Fri - 12/09Sat - 12/10Sun - 12/11Mon - 12/12
6CC Review:575540614803803669729789432321506475
7DE - ALF:81105981231491254114327278113
8DE - BF:10811413314115417813093104116131151
9DE - CHR:236200250270309271234203208258279311
10DE - ER:1621314045561821223142
11DE - IF:887852835781840719716665634595526593
12DE - MP:644440222766
13DE - NM:1,4251,4091,4501,4471,5591,5091,4641,4011,4341,4631,4881,606
14DE - SM:428439450488530516392361364356407463
15DE - ST:513499497523563581589554565573595620
16DB:129525959599210111878959596
17DE Total w/C & D:4,4044,2354,4214,6795,0154,7164,3994,2083,8743,8784,1424,476
18DE w/C:4,2754,1834,3624,6204,9564,6244,2984,0903,7963,7834,0474,380
19DE Cnt w/D:3,8293,6953,8073,8764,2124,0473,6703,4193,4423,5573,6364,001
20DE WQ Only Cnt:3,7003,6433,7483,8174,1533,9553,5693,3013,3643,4623,5413,905
21Daily Change in DE WQ Only Cnt:(93)(57)10569336(198)(386)(268)639879364
22Weekly Change in DE Only Cnt:82846344824725751(224)(399)(279)(286)(276)(248)
23Weekly Change in DE + DG Cnt:84940739919820831(245)(410)(253)(250)(240)(211)
24Running Av DE Only - 30 days:2,8322,8762,9292,9863,0493,0963,1213,1423,1743,2153,2603,310
25Running Av DE Only - 90 days:2,6272,6452,6582,6702,6852,6972,7082,7182,7272,7342,7392,748
26WQ Total Cnt Goal:2,2002,2002,2002,2002,2002,2002,2002,2002,2002,2002,2002,200
Daily Charts
Cell Formulas
RangeFormula
B3:M3B3=WEEKNUM(B1)
B4B4=VLOOKUP(WEEKDAY(B1), 'Day of Week X Walk'!$A$2:D8, 3, FALSE)
C4C4=VLOOKUP(WEEKDAY(C1), 'Day of Week X Walk'!$A$2:D8, 3, FALSE)
D4D4=VLOOKUP(WEEKDAY(D1), 'Day of Week X Walk'!$A$2:D8, 3, FALSE)
E4E4=VLOOKUP(WEEKDAY(E1), 'Day of Week X Walk'!$A$2:D8, 3, FALSE)
F4F4=VLOOKUP(WEEKDAY(F1), 'Day of Week X Walk'!$A$2:D8, 3, FALSE)
G4G4=VLOOKUP(WEEKDAY(G1), 'Day of Week X Walk'!$A$2:D8, 3, FALSE)
H4H4=VLOOKUP(WEEKDAY(H1), 'Day of Week X Walk'!$A$2:D8, 3, FALSE)
I4I4=VLOOKUP(WEEKDAY(I1), 'Day of Week X Walk'!$A$2:D8, 3, FALSE)
J4J4=VLOOKUP(WEEKDAY(J1), 'Day of Week X Walk'!$A$2:D8, 3, FALSE)
K4K4=VLOOKUP(WEEKDAY(K1), 'Day of Week X Walk'!$A$2:D8, 3, FALSE)
L4L4=VLOOKUP(WEEKDAY(L1), 'Day of Week X Walk'!$A$2:D8, 3, FALSE)
M4M4=VLOOKUP(WEEKDAY(M1), 'Day of Week X Walk'!$A$2:D8, 3, FALSE)
B5:M5B5=B4&" - "& TEXT(B2, "m/dd")
B17:M17B17=SUM(B6:B16)
B18:M19B18=SUM(B6:B15)
B20:M20B20=SUM(B7:B15)
 
Upvote 0
can you add another sheet to your workbook for your chart to actually pull from? this sheet can pull the last 60 days from the main data sheet.
you can keep adding to your main data sheet, but the chart data sheet would only see the last 60 days.

Book1
ABCDEFBDBEBFBGBHBI
1Long Date 1/29/20231/30/20231/31/20232/1/20232/2/20233/24/20233/25/20233/26/20233/27/20233/28/20233/29/2023
2Short Date:1/291/301/312/12/23/243/253/263/273/283/29
3Week of Year:55555121213131313
4Day of Week:SunMonTueWedThuFriSatSunMonTueWed
5Day - Date:Sun - 01/29Mon - 01/30Tue - 01/31Wed - 02/01Thu - 02/02Fri - 03/24Sat - 03/25Sun - 03/26Mon - 03/27Tue - 03/28Wed - 03/29
6CC Review:-386-404-423-441-460-1385-1404-1422-1441-1459-1478
7DE - ALF:-104-108-111-115-119-296-300-303-307-311-314
8DE - BF:146147147147148164164164165165165
9DE - CHR:426429432436439601604607611614617
10DE - ER:3838383838474848484848
11DE - IF:-984-1016-1048-1080-1112-2704-2736-2768-2800-2832-2864
12DE - MP:99999131313141414
13DE - NM:18841892190019081915230223092317232523322340
14DE - SM:9488817569-248-255-261-267-274-280
15DE - ST:10731083109211021112159516051614162416341643
16DB:190192194196198295297299301303305
17DE Total w/C & D:23862349231222752238383346309272235197
18DE w/C:2196215721182079204087489-30-69-108
19DE Cnt w/D:27722753273527162697176817501731171216941675
20DE WQ Only Cnt:25812561254025202499147314521432141113911370
21Daily Change in DE WQ Only Cnt:790804819834848157715921607162116361650
22Weekly Change in DE Only Cnt:-5282-5382-5482-5581-5681-10663-10763-10862-10962-11062-11161
23Weekly Change in DE + DG Cnt:-4900-4993-5085-5177-5270-9887-9979-10072-10164-10256-10349
24Running Av DE Only - 30 days:5317.744685359.526155401.307615443.089085484.870557573.9439787615.7254477657.5069157699.2883847741.0698527782.851321
25Running Av DE Only - 90 days:3276.121313286.957123297.792923308.628733319.464533861.2548313872.0906363882.9264423893.7622483904.5980543915.43386
26WQ Total Cnt Goal:22002200220022002200220022002200220022002200
chart data
Cell Formulas
RangeFormula
B1:F1,BD1:BH1B1=C1-1
BI1BI1=TODAY()
B2:F2,BD2:BI2B2=B1
B3:F3,BD3:BI3B3=WEEKNUM(B1)
B4:F4,BD4:BI4B4=B1
B5:F5,BD5:BI5B5=B1
A6:BI26A6=FILTER(data!6:26,data!1:1>='chart data'!B1,"")
Dynamic array formulas.


*i had to hide many columns in order to be able to use plugin, but this should give you an idea

I could do that. What function would you suggest using? XLOOKUP? I was wondering if my problem was using calculated data vs raw data in my spreadsheet? Does anyone know if the Offset function has issues with calculated data vs raw data? You wouldn't think it should matter, but I am wondering if it does.
 
Upvote 0
in the above post i have it filtering from the main data sheet based on date, and it returns all the values from -60 thru today()
just paste in the formula. (probably will need to update the sheet name for the running data sheet in the formula)
this will giving you the running 60 days
Excel Formula:
=FILTER(data!6:26,data!1:1>=B1,"")
to c6 under this:
Offset Function-Dynamic Charts.xlsx
ABCDEFGHIJKLMNOPQRSTUVWXYZAAABACADAEAFAGAHAIAJAKALAMANAOAPAQARASATAUAVAWAXAYAZBABBBCBDBEBFBGBHBI
1Long Date 1/29/20231/30/20231/31/20232/1/20232/2/20232/3/20232/4/20232/5/20232/6/20232/7/20232/8/20232/9/20232/10/20232/11/20232/12/20232/13/20232/14/20232/15/20232/16/20232/17/20232/18/20232/19/20232/20/20232/21/20232/22/20232/23/20232/24/20232/25/20232/26/20232/27/20232/28/20233/1/20233/2/20233/3/20233/4/20233/5/20233/6/20233/7/20233/8/20233/9/20233/10/20233/11/20233/12/20233/13/20233/14/20233/15/20233/16/20233/17/20233/18/20233/19/20233/20/20233/21/20233/22/20233/23/20233/24/20233/25/20233/26/20233/27/20233/28/20233/29/2023
2Short Date:1/291/301/312/12/22/32/42/52/62/72/82/92/102/112/122/132/142/152/162/172/182/192/202/212/222/232/242/252/262/272/283/13/23/33/43/53/63/73/83/93/103/113/123/133/143/153/163/173/183/193/203/213/223/233/243/253/263/273/283/29
3Week of Year:5555555666666677777778888888999999910101010101010111111111111111212121212121213131313
4Day of Week:SunMonTueWedThuFriSatSunMonTueWedThuFriSatSunMonTueWedThuFriSatSunMonTueWedThuFriSatSunMonTueWedThuFriSatSunMonTueWedThuFriSatSunMonTueWedThuFriSatSunMonTueWedThuFriSatSunMonTueWed
5Day - Date:Sun - 01/29Mon - 01/30Tue - 01/31Wed - 02/01Thu - 02/02Fri - 02/03Sat - 02/04Sun - 02/05Mon - 02/06Tue - 02/07Wed - 02/08Thu - 02/09Fri - 02/10Sat - 02/11Sun - 02/12Mon - 02/13Tue - 02/14Wed - 02/15Thu - 02/16Fri - 02/17Sat - 02/18Sun - 02/19Mon - 02/20Tue - 02/21Wed - 02/22Thu - 02/23Fri - 02/24Sat - 02/25Sun - 02/26Mon - 02/27Tue - 02/28Wed - 03/01Thu - 03/02Fri - 03/03Sat - 03/04Sun - 03/05Mon - 03/06Tue - 03/07Wed - 03/08Thu - 03/09Fri - 03/10Sat - 03/11Sun - 03/12Mon - 03/13Tue - 03/14Wed - 03/15Thu - 03/16Fri - 03/17Sat - 03/18Sun - 03/19Mon - 03/20Tue - 03/21Wed - 03/22Thu - 03/23Fri - 03/24Sat - 03/25Sun - 03/26Mon - 03/27Tue - 03/28Wed - 03/29
chart data
Cell Formulas
RangeFormula
B1:BH1B1=C1-1
BI1BI1=TODAY()
B2:BI2B2=B1
B3:BI3B3=WEEKNUM(B1)
B4:BI4B4=B1
B5:BI5B5=B1
Great - thank you! I think I figured out my issues. There were NA values in the data set and blanks. I didn't see those until going through column by column as the data set is so large. I am going to try it adding a formula to fix those cells and try again. Thank you again for your help. I will keep your formula handy as well if all fails.
 
Upvote 0
Solution

Forum statistics

Threads
1,214,940
Messages
6,122,361
Members
449,080
Latest member
Armadillos

We've detected that you are using an adblocker.

We have a great community of people providing Excel help here, but the hosting costs are enormous. You can help keep this site running by allowing ads on MrExcel.com.
Allow Ads at MrExcel

Which adblocker are you using?

Disable AdBlock

Follow these easy steps to disable AdBlock

1)Click on the icon in the browser’s toolbar.
2)Click on the icon in the browser’s toolbar.
2)Click on the "Pause on this site" option.
Go back

Disable AdBlock Plus

Follow these easy steps to disable AdBlock Plus

1)Click on the icon in the browser’s toolbar.
2)Click on the toggle to disable it for "mrexcel.com".
Go back

Disable uBlock Origin

Follow these easy steps to disable uBlock Origin

1)Click on the icon in the browser’s toolbar.
2)Click on the "Power" button.
3)Click on the "Refresh" button.
Go back

Disable uBlock

Follow these easy steps to disable uBlock

1)Click on the icon in the browser’s toolbar.
2)Click on the "Power" button.
3)Click on the "Refresh" button.
Go back
Back
Top