I have recently written a macro to measure prouctivity on a sales v labor basis, my problem is I cant figure out how to get the charts to organize themselves so I dont have to.
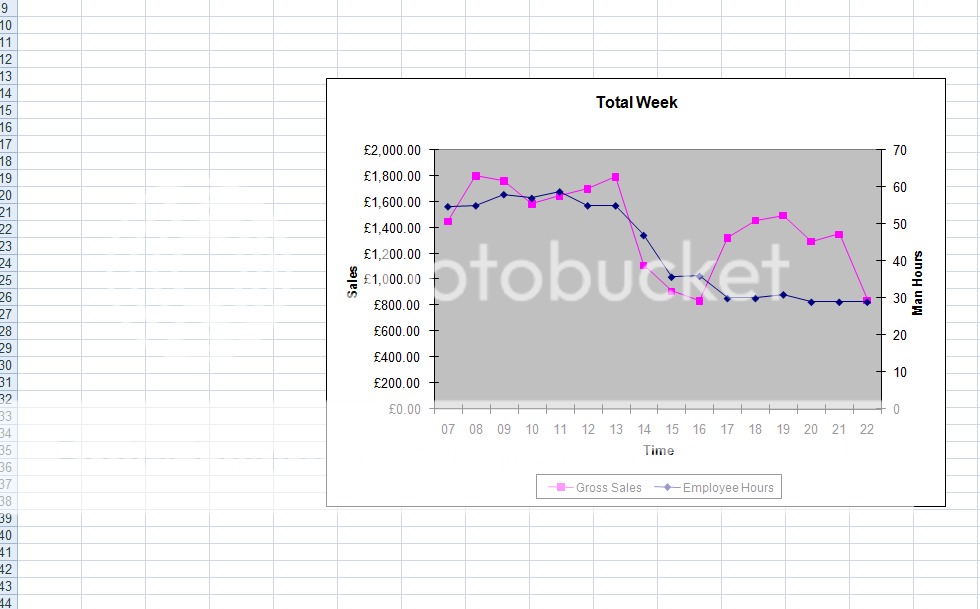
Basically at the moment the are embedding themselves on top of each other like this
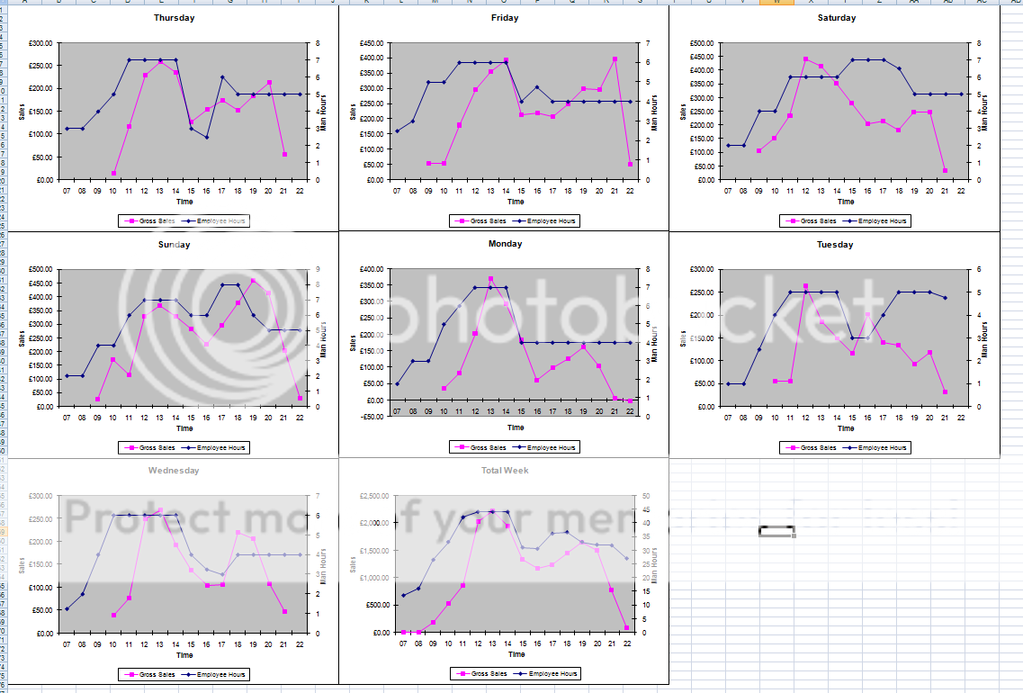
but I need them to look like this on 1 page
any idea on how I can do this?
Basically at the moment the are embedding themselves on top of each other like this
but I need them to look like this on 1 page
any idea on how I can do this?


