Hi,
I have some task - that looks like very easy, but... I cannot find solution
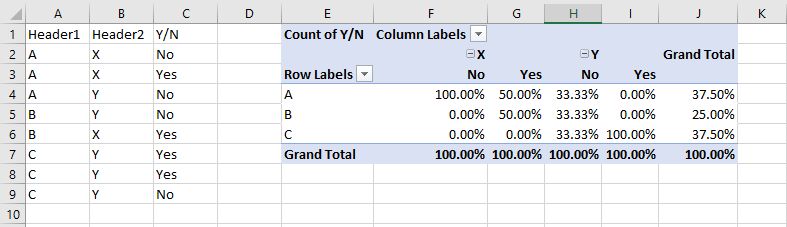
I have data like this:
<tbody>
</tbody>
And want to get report showing the percent of Yes/Total:
<tbody>
</tbody>
How to build that?
Does Pivot Table do this? Or I need some transformation in PowerQuery?
I have some task - that looks like very easy, but... I cannot find solution
I have data like this:
| Column1 | Column2 |
| A | No |
| A | Yes |
| A | No |
| B | No |
| B | Yes |
| C | Yes |
| C | Yes |
| C | No |
<tbody>
</tbody>
And want to get report showing the percent of Yes/Total:
| Column1 | Yes/Total |
| A | 33,33% |
| B | 50,00% |
| C | 66,67% |
<tbody>
</tbody>
How to build that?
Does Pivot Table do this? Or I need some transformation in PowerQuery?