Hello,
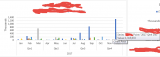
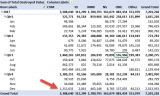
I have a Pivot Chart created that is filtered by Splicers. I would like to have the users of my dashboard to be able to hover over each bar to display both the Value (as seen below) in addition to the count of total items that make up the Value. When I add the count to the pivot it simply creates more Series which I don't want. I am a novice at VBA so any help is greatly appreciated.
If VBA is needed, I would also like to be able to display both the values and count with clear labels in the hover (something more organized than the current hover)
TIA


