dennisstinissen
New Member
- Joined
- Sep 3, 2007
- Messages
- 3
I haven't been arround for a while, but after some time off I'm getting back on track with Excel.
I'm walking in circles with this one and I think this should be possible in Excel, but I can't seem to resolve it. It has to do with a graph I want to make and I use a pivot table, but hey I think I am off track.
I have a worksheet with data in a table
Record;Start date;Planned Date; End Date
Record 1; 20210101; 20210301;
Record 2; 20210201; 20210501; 20210419
Record 3; 20210214; 20210228; 20210318
...
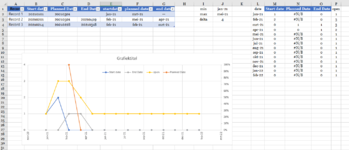
And the result I would like to have is a graph (and pivot)
On the horizontal axis we have the months (januari 2021 until januari 2022)
On the vertical axis we have a line with the amount of new records (start date in that month) a a given month
On the vertical axis we have another line with the amount of closed records (end date in that month)
On the vertical axis we have a bar with the amount of records still open
On the vertical axis we have another line with the percentage of closed records as planned (end date earlier or same as planned date)
Could someone point me in the right direction?
I'm walking in circles with this one and I think this should be possible in Excel, but I can't seem to resolve it. It has to do with a graph I want to make and I use a pivot table, but hey I think I am off track.
I have a worksheet with data in a table
Record;Start date;Planned Date; End Date
Record 1; 20210101; 20210301;
Record 2; 20210201; 20210501; 20210419
Record 3; 20210214; 20210228; 20210318
...
And the result I would like to have is a graph (and pivot)
On the horizontal axis we have the months (januari 2021 until januari 2022)
On the vertical axis we have a line with the amount of new records (start date in that month) a a given month
On the vertical axis we have another line with the amount of closed records (end date in that month)
On the vertical axis we have a bar with the amount of records still open
On the vertical axis we have another line with the percentage of closed records as planned (end date earlier or same as planned date)
Could someone point me in the right direction?