I have a complaints spreadsheet which records complaints over the year by customer, week number/ date, type of product, sub type, the type of complaint, and whether it has been accepted or rejected.
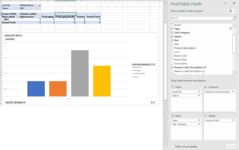
The current pivot table works absolutely fine - see attached showing all complaints for type UHT.
As you can see there are 4 types of complaints in that week - Appearance, Packaging, Packaging (Leak), Texture.
The column this is pulling from is a free field text so over the year the same type of complaint can be written in different ways.
To improve this it has been set to a list.
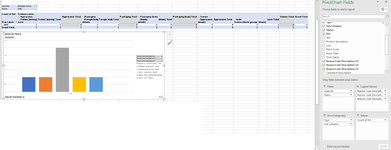
However as this was a free text field there were sometimes as many as 3 separate complaints on the same product -
e.g. Blown, Mould, Packaging (cap) etc.
As such two other columns were added so that all complaint 'types/ reasons' related to the complaint could be recorded.
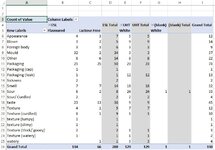
I thought this would be a simple addition to the pivot table of the two other columns but instead it sub totals them and counts them as each individual occurrence of the complaints against said product type that week:
e.g. Packaging - Appearance - (blank)
Any help would be appreciated, its driving me round the bend.
The current pivot table works absolutely fine - see attached showing all complaints for type UHT.
As you can see there are 4 types of complaints in that week - Appearance, Packaging, Packaging (Leak), Texture.
The column this is pulling from is a free field text so over the year the same type of complaint can be written in different ways.
To improve this it has been set to a list.
However as this was a free text field there were sometimes as many as 3 separate complaints on the same product -
e.g. Blown, Mould, Packaging (cap) etc.
As such two other columns were added so that all complaint 'types/ reasons' related to the complaint could be recorded.
I thought this would be a simple addition to the pivot table of the two other columns but instead it sub totals them and counts them as each individual occurrence of the complaints against said product type that week:
e.g. Packaging - Appearance - (blank)
Any help would be appreciated, its driving me round the bend.