Pivot Table vs Formulas for Sales Report

BLuse

New Member
Joined
Apr 15, 2016
Messages
13
Hi!

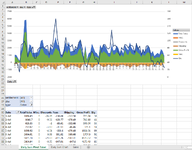
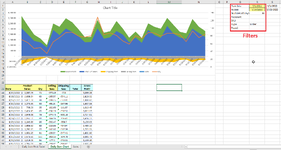
I am creating dashboard to track and analyze sales data. At first, I started with formulas and a chart. While I was trying to figure out how to do a formula, I realized that I can create the same chart using a pivot table instead.

Now that I have both version created, I wonder if there is cons to option over the other. I would like to hear from the pros which method will be better in the long run.

Some things to consider: I will likely want to create other charts based on the results of my daily sum chart. For example, this chart doesn't include COGs. I will need to create a new chart to pull in COGs to calculate net profit. On the other hand pivot tables might be simpler to create and lighter on excel.

Please advise!
 

Attachments

  • 2022_11_03_14_22_10_Sales_Report.xlsx_Excel.png
    2022_11_03_14_22_10_Sales_Report.xlsx_Excel.png
    109 KB · Views: 12
  • 2022_11_03_14_28_19_Sales_Report.xlsx_Excel.png
    2022_11_03_14_28_19_Sales_Report.xlsx_Excel.png
    127.5 KB · Views: 11

Excel Facts

Test for Multiple Conditions in IF?
Use AND(test, test, test, test) or OR(test, test, test, ...) as the logical_test argument of IF.
That mostly depends on which version of Excel you're using which you haven't specified in your profile. If you don't have a version of Excel that supports spilled arrays, stick to Pivot Tables, or at the very least use Excel Tables, not unstructured data.

If you have Microsoft 365 (or Excel 2021), you can build complete reports using a single spilled array formula which update instantly when the source data changes. Downside is that kind of formula gets a bit complex, although you can use much simpler formulas with one formula in each column which can even reference results in another spilled array column. Note that Excel Tables do NOT support spilled arrays, so these would be straight unstructured data with only the spilled operator (#) to reference - or a named range of that reference.

Pivot tables are more reliable and very easy to create. If you get down and dirty with Measures or the Data Model where you can use DAX, you can create some very fast data analysis formulas. The down side is that they typically need to be refreshed when the data changes, especially if they feed charts. Also, getting information like YTD or % Change into the table typically requires either a measure or DAX. They cannot display text without special tricks (many videos on YouTube for that!).

One deciding factor can easily be the amount of data. Worksheets have a limit of 1,048,576 rows and 16,384 columns (17,179,869,184 cells), but using the Data Model much more than that can be pulled into Excel and then analyzed with a Pivot Table or Pivot Chart. I have a sample with 10 Million rows of data, and the file sizes are relatively small for the amount of data. In this case Power Pivot is the only solution.


Let everyone be able to tell which version of Excel you're using (OS and Excel Version) in your Profile, and don't forget to use XL2BB when posting data!
 
Upvote 0

Forum statistics

Threads
1,214,972
Messages
6,122,530
Members
449,088
Latest member
RandomExceller01

We've detected that you are using an adblocker.

We have a great community of people providing Excel help here, but the hosting costs are enormous. You can help keep this site running by allowing ads on MrExcel.com.
Allow Ads at MrExcel

Which adblocker are you using?

Disable AdBlock

Follow these easy steps to disable AdBlock

1)Click on the icon in the browser’s toolbar.
2)Click on the icon in the browser’s toolbar.
2)Click on the "Pause on this site" option.
Go back

Disable AdBlock Plus

Follow these easy steps to disable AdBlock Plus

1)Click on the icon in the browser’s toolbar.
2)Click on the toggle to disable it for "mrexcel.com".
Go back

Disable uBlock Origin

Follow these easy steps to disable uBlock Origin

1)Click on the icon in the browser’s toolbar.
2)Click on the "Power" button.
3)Click on the "Refresh" button.
Go back

Disable uBlock

Follow these easy steps to disable uBlock

1)Click on the icon in the browser’s toolbar.
2)Click on the "Power" button.
3)Click on the "Refresh" button.
Go back
Back
Top