Sub charttest()
Dim XRng As Range, YRng As Range, Cnt As Integer, LastRow As Integer
Dim objCht As ChartObject, LastCol As Integer, Cntr As Integer
Dim MyChart As Chart, ChartName As String, MyChartFrame As ChartObject
Dim ws As Worksheet
Set ws = Sheets("sheet1")
'remove previous chart
If ws.ChartObjects.Count > 0 Then
Set MyChartFrame = ws.ChartObjects(ws.ChartObjects.Count)
Set MyChart = MyChartFrame.Chart
'Remove SheetName from ChartName
ChartName = MyChart.Name
ChartName = Right(ChartName, Len(ChartName) - Len(ws.Name) - 1)
ws.ChartObjects(ChartName).Delete
End If
'add chart
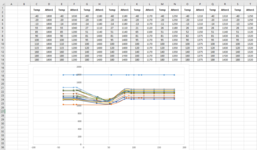
Set objCht = ws.ChartObjects.Add(10, 20, 500, 200)
With ws
LastCol = .Cells(3, .Columns.Count).End(xlToLeft).Column
LastRow = .Range("C" & .Rows.Count).End(xlUp).Row
End With
For Cnt = 3 To LastCol Step 2
With ws
Set XRng = .Range(.Cells(3, Cnt), .Cells(LastRow, Cnt))
Set YRng = .Range(.Cells(3, Cnt + 1), .Cells(LastRow, Cnt + 1))
End With
Cntr = Cntr + 1
With objCht
.Chart.SeriesCollection.NewSeries
.Chart.SeriesCollection(Cntr).Values = XRng
.Chart.SeriesCollection(Cntr).XValues = YRng
.Chart.SeriesCollection(Cntr).ChartType = xlXYScatterSmoothNoMarkers
End With
Next Cnt