plotting high-low range lines on column chart

moldoverb

New Member
Joined
Jan 9, 2009
Messages
7
Hi all, I am trying to generate a column chart with a high-low range overlay so that it looks like error bars. I've precalculated all values but cannot figure out how to add the high-low range lines. The ranges are in the min and max columns.

I tried using custom error bars but it did not work. Any help would be greatly appreciated.
11437664936_2aec5e1069.jpg
 

Excel Facts

Best way to learn Power Query?
Read M is for (Data) Monkey book by Ken Puls and Miguel Escobar. It is the complete guide to Power Query.
I also see that you can't use up-down bars on this type of chart, which is exactly what I need. Any suggestions?
 
Upvote 0
First you mentioned error bars, so I thought of this solution.

DotsWithErrorBars.png


Here's how it works.

I rearranged your columns and added a couple. I staggered the COPD and SMOKE rows so the dots and error bars wouldn't obscure each other, and inserted a blank row between assays. I labeled both rows of each assay's data with the assay ID, but you can get away with just labeling the first. or if you want to get fancy (which I won't), take measures to provide a centered label.

I made a line chart with the first three columns, and removed the connecting lines, leaving the markers. I prefer using markers instead of bars for scientific data, by the way.

Since you have to input the lengths of custom error bars, not the point at which they end, I computed the lengths I needed (Cdown, Cup, Sdown, Sup) by computing the difference between the value plotted by the markers and the min and max. These values (columns H:K) are what I used for my custom error bar values.
 
Upvote 0
Then you bemoaned the lack of up-down bars, but since I changed from a column chart to a line chart, I could get these instead of error bars.

So here's the second solution.

DotsWithUpDownBars.png


I'll describe the rearrangement of columns as I proceed.

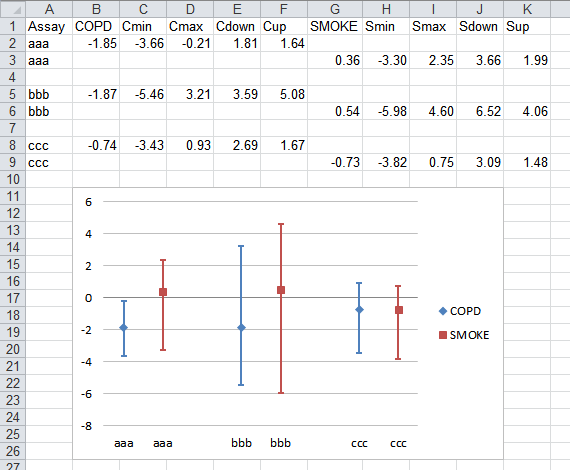
As with the first solution, I staggered the COPD and SMOKE rows so the dots and error bars wouldn't obscure each other, and inserted a blank row between assays. I labeled both rows of each assay's data with the assay ID, but you can just label the first, or take measures to provide a centered label.

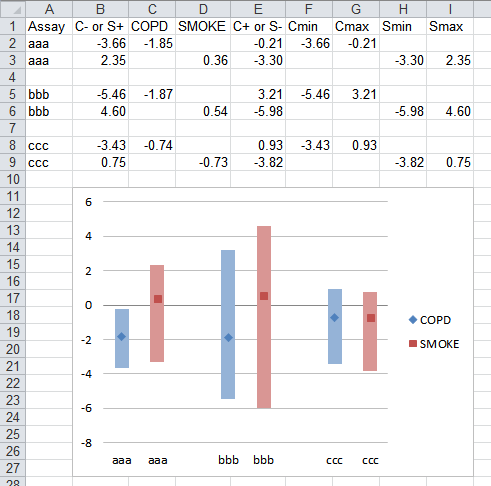
Up-down bars connect the first and last line chart data points in the chart, which are columns B and E in this example (columns C and D contain the plain old data points). I wanted different colors for the bars behind the COPD and the SMOKE data points. So for the COPD rows, I put the minimum in the first data column and the maximum in the fourth, so the COPD bar would be an up bar. For the SMOKE rows, I switched, putting the max in the first data column and the min in the fourth, so the SMOKE bar would be a down bar.

I made a line chart using the first five columns, did some formatting (shown below) and got the resulting chart.

DotsWithUpDownBars2.png


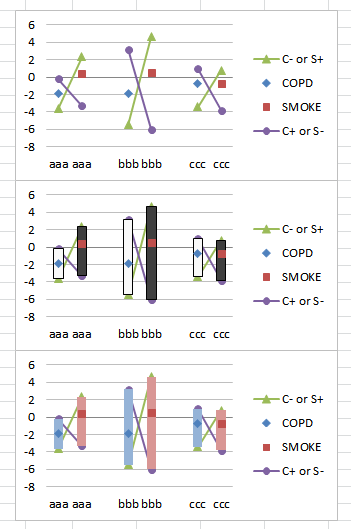
The first chart in this sequence shows the initial line chart. I've already reformatted the colors and marker shapes to match my first colution.

The second chart shows the up-down bars added to the chart.

In the third chart, I've formatted the up bars with a lighter blue to match the COPD markers, and the down bars with a lighter red to match the SMOKE markers.

For the final chart, I hid the first and fourth line chart series by formatting them with no markers and no lines. I also removed their entries from the legend. To remove a single legend entry, click once to select the legend, click a second time to select the unwanted legend entry, then press Delete.
 
Upvote 0

Forum statistics

Threads
1,214,636
Messages
6,120,669
Members
448,977
Latest member
moonlight6

We've detected that you are using an adblocker.

We have a great community of people providing Excel help here, but the hosting costs are enormous. You can help keep this site running by allowing ads on MrExcel.com.
Allow Ads at MrExcel

Which adblocker are you using?

Disable AdBlock

Follow these easy steps to disable AdBlock

1)Click on the icon in the browser’s toolbar.
2)Click on the icon in the browser’s toolbar.
2)Click on the "Pause on this site" option.
Go back

Disable AdBlock Plus

Follow these easy steps to disable AdBlock Plus

1)Click on the icon in the browser’s toolbar.
2)Click on the toggle to disable it for "mrexcel.com".
Go back

Disable uBlock Origin

Follow these easy steps to disable uBlock Origin

1)Click on the icon in the browser’s toolbar.
2)Click on the "Power" button.
3)Click on the "Refresh" button.
Go back

Disable uBlock

Follow these easy steps to disable uBlock

1)Click on the icon in the browser’s toolbar.
2)Click on the "Power" button.
3)Click on the "Refresh" button.
Go back
Back
Top